Find a Job You Really Want In
Despite women achieving higher education levels than men, the financial disparity remains stark.
As we move into 2026, the challenges faced by women in the United States are still significant. Issues such as wage inequality, underrepresentation in leadership positions, and the burden of unpaid labor continue to impact women’s lives.
The United States comprises fifty states, each with its own unique socio-economic landscape. Recognizing that no two states are alike, we set out to analyze which states present the most challenges for women. The findings reveal a stark difference in the quality of life for women across the country.
Below, we highlight the states where women face the greatest difficulties in terms of economic opportunity and overall well-being.
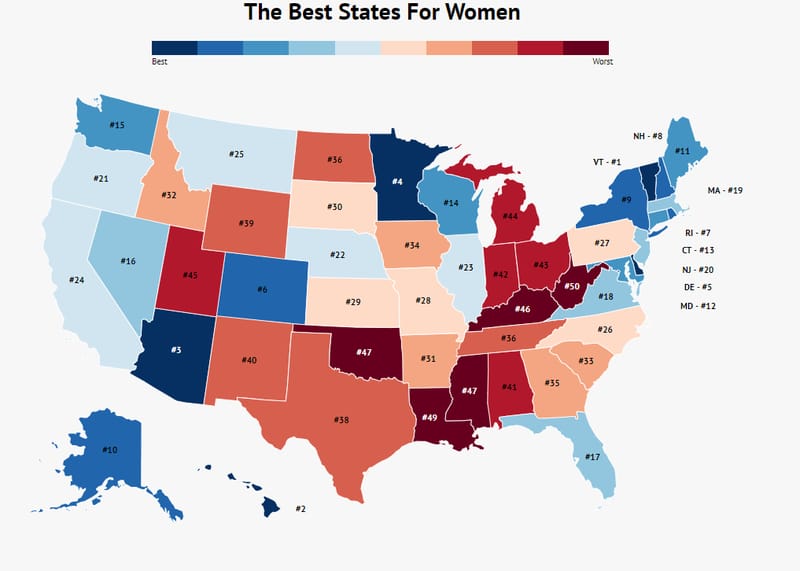
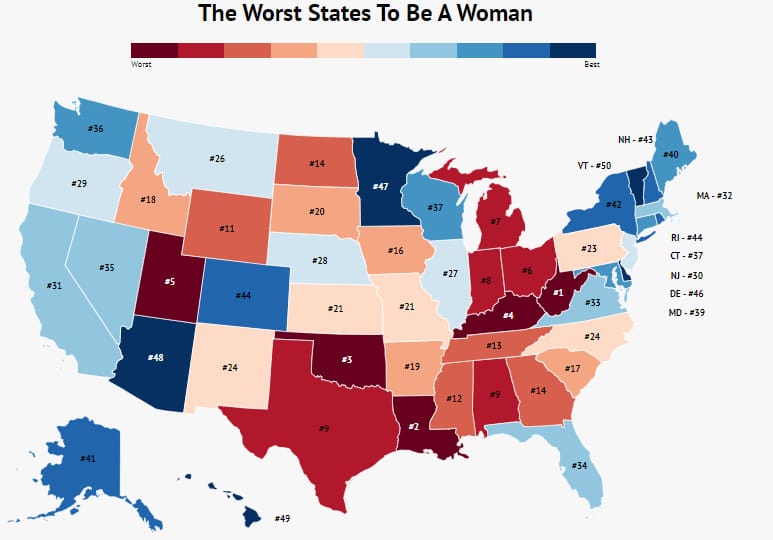
Worst States for Women
The states listed above rank among the worst for women, showcasing significant economic disparities and limited opportunities. Notably, several states in the Rust Belt region appear on this list, indicating broader regional challenges for women.
If your state isn’t in the bottom 10, check at the end of the article to see how it compares. Let’s explore the criteria used to identify these challenging states for women.
How We Determined the Worst States for Women
Each state was ranked from 1 to 50 across four key categories:
- Percentage of Women CEOs (Lower is worse)
- Percentage of Women in Poverty (Higher is worse)
- Income Gap Between Male and Female Earners (Higher is worse)
- Life Expectancy (Lower is worse)
To assess the income gap between men and women, we referenced the Census Bureau’s American Community Survey. We calculated the income gap by dividing the median income of women by that of men and subtracting from 100.
For the percentage of women living in poverty, we utilized data from the ACS, focusing on women living alone to provide a clearer picture of financial hardship. This approach highlights the struggles faced by women without familial support.
The inclusion of women CEOs reflects the level of advancement opportunities available to women in each state. As research shows, women are more likely to promote other women, making this metric crucial for understanding women’s representation in leadership roles. We obtained this data from DiscoverOrg.
Life expectancy data was sourced from the Institute for Health Metrics, as it serves as an indicator of overall health and societal conditions impacting women.
The full list of all fifty states and their scores in each category is available at the end. Now, let’s take a closer look at the states that rank the best for women.
1. West Virginia

Wage Gap: 34%
Women in Poverty: 33%
Life Expectancy: 74.8
Women CEOs: 17%
West Virginia ranks as the worst state for women due to its consistently low scores across all categories. Women here are more likely to experience poverty and earn significantly less than their male counterparts, with a wage gap of 34%. Coupled with a low life expectancy, the challenges for women in this state are severe.
2. Louisiana

Wage Gap: 38%
Women in Poverty: 35%
Life Expectancy: 75.4
Women CEOs: 21.2%
Louisiana follows closely behind as the second worst state for women, marked by high poverty rates and low life expectancy. The statistics reveal a troubling landscape for women in Louisiana.
3. Oklahoma
Wage Gap: 32%
Women in Poverty: 30%
Life Expectancy: 75.4
Women CEOs: 19%
In Oklahoma, while women make slightly more than those in Louisiana, the high poverty rates and low percentage of female CEOs indicate a lack of opportunity and advancement.
4. Kentucky

Wage Gap: 29%
Women in Poverty: 32%
Life Expectancy: 75
Women CEOs: 18%
Kentucky ranks as the fourth worst state for women, with only 18% of CEOs being female and a significant percentage of women living in poverty.
5. Utah

Wage Gap: 45%
Women in Poverty: 30%
Life Expectancy: 79.3
Women CEOs: 17%
Utah may surprise some, known for its affordable living, but it has the worst gender wage gap in the nation, with women earning 45% less than men.
6. Ohio
Wage Gap: 33%
Women in Poverty: 27%
Life Expectancy: 76.6
Women CEOs: 20.8%
Ohio ranks sixth for women, with a better poverty rate than the top five states, yet still faces issues with low life expectancy and female leadership.
7. Michigan
Wage Gap: 34%
Women in Poverty: 29%
Life Expectancy: 77.6
Women CEOs: 22.8%
Michigan holds the seventh spot, with a substantial wage gap and a low percentage of women in executive roles.
8. Indiana
Wage Gap: 35%
Women in Poverty: 27%
Life Expectancy: 77
Women CEOs: 23%
Indiana ranks just behind Michigan, with a concerning wage gap and limited representation of women in leadership.
9. Texas

Wage Gap: 31%
Women in Poverty: 29%
Life Expectancy: 78.5
Women CEOs: 19.7%
Texas showcases a high poverty rate for women, compounded by a significant wage gap and a lack of female executives.
10. Alabama

Wage Gap: 33%
Women in Poverty: 34%
Life Expectancy: 74.9
Women CEOs: 30%
Alabama rounds out the top ten worst states for women, with a notable percentage of female CEOs, yet still struggles with poverty rates among women.
Summary of the Worst States for Women
The states listed here represent the most challenging environments for women in the U.S. While progress has been made in some areas, significant disparities persist. No state boasts a 50% female CEO representation, highlighting widespread barriers to women entering leadership roles. Similarly, the wage gaps remain alarming, with women in the worst states earning less compared to their male counterparts.
While West Virginia may not be the worst state for every individual woman, its systemic issues undoubtedly hinder the well-being of its female residents.
Check the complete ranking to see how your state measures up.
Worst States for Women
| Rank | State | Wage Gap | Women in Poverty (%) | Life Expectancy | Female CEOs (%) |
|---|---|---|---|---|---|
| 1 | West Virginia | 34% | 33 | 74 | 17 |
| 2 | Louisiana | 38% | 35 | 75 | 21 |
| 3 | Oklahoma | 32% | 30 | 75 | 19 |
| 4 | Kentucky | 29% | 32 | 75 | 18 |
| 5 | Utah | 45% | 30 | 79 | 17 |
| 6 | Ohio | 33% | 27 | 76 | 20 |
| 7 | Michigan | 34% | 29 | 77 | 22 |
| 8 | Indiana | 35% | 27 | 77 | 23 |
| 9 | Texas | 31% | 29 | 78 | 19 |
| 10 | Alabama | 33% | 34% | 74 | 30% |
| 11 | Wyoming | 40% | 31% | 78 | 25% |
| 12 | Mississippi | 29% | 36% | 74 | 28% |
| 13 | Tennessee | 27% | 30% | 76 | 22% |
| 14 | Georgia | 27% | 28% | 77 | 22% |
| 14 | North Dakota | 33% | 27% | 78 | 23% |
| 16 | Iowa | 34% | 27% | 79 | 21% |
| 17 | South Carolina | 27% | 30% | 76 | 24% |
| 18 | Idaho | 38% | 29% | 79 | 26% |
| 19 | Arkansas | 26% | 34% | 75 | 26% |
| 20 | South Dakota | 29% | 26% | 78 | 21% |
| 21 | Missouri | 28% | 26% | 77 | 22% |
| 21 | Kansas | 33% | 27% | 78 | 24% |
| 23 | Pennsylvania | 31% | 26% | 78 | 22% |
| 24 | North Carolina | 25% | 27% | 77 | 22% |
| 24 | New Mexico | 26% | 32% | 77 | 25% |
| 26 | Montana | 28% | 28% | 76 | 40% |
| 27 | Illinois | 30% | 26% | 79 | 23% |
| 28 | Nebraska | 32% | 25% | 79 | 24% |
| 29 | Oregon | 29% | 27% | 79 | 23% |
| 30 | New Jersey | 32% | 22% | 80 | 20% |
| 31 | California | 25% | 28% | 80% | 21% |
| 32 | Massachusetts | 30% | 23% | 79% | 20% |
| 33 | Virginia | 30% | 25% | 79% | 24% |
| 34 | Florida | 21% | 27% | 79% | 22% |
| 35 | Nevada | 20% | 27% | 77% | 25% |
| 36 | Washington | 34% | 24% | 79% | 25% |
| 37 | Connecticut | 31% | 24% | 80% | 23% |
| 37 | Wisconsin | 32% | 25% | 79% | 27% |
| 39 | Maryland | 25% | 22% | 78% | 22% |
| 40 | Maine | 27% | 26% | 78% | 30% |
| 41 | Alaska | 29% | 21% | 77% | 33% |
| 42 | New York | 24% | 26% | 80% | 22% |
| 43 | New Hampshire | 31% | 19% | 79% | 28% |
| 44 | Rhode Island | 27% | 26% | 79% | 28% |
| 44 | Colorado | 27% | 22% | 79% | 23% |
| 46 | Delaware | 24% | 25% | 78% | 32% |
| 47 | Minnesota | 28% | 23% | 80% | 24% |
| 48 | Arizona | 23% | 24% | 79% | 26% |
| 49 | Hawaii | 22% | 25% | 81% | 28% |
| 50 | Vermont | 24% | 24% | 79% | 38% |
For the latest research and engaging stories, email Kathy Morris at kmorris@zippia.com to subscribe to our weekly newsletter.
Author
Kathy is the head of content at Zippia with a knack for engaging audiences. Prior to joining Zippia, Kathy worked at Gateway Blend growing audiences across diverse brands. She graduated from Troy University with a degree in Social Science Education.