Find a Job You Really Want In
Understanding the Risks: The Most Dangerous States in the U.S.
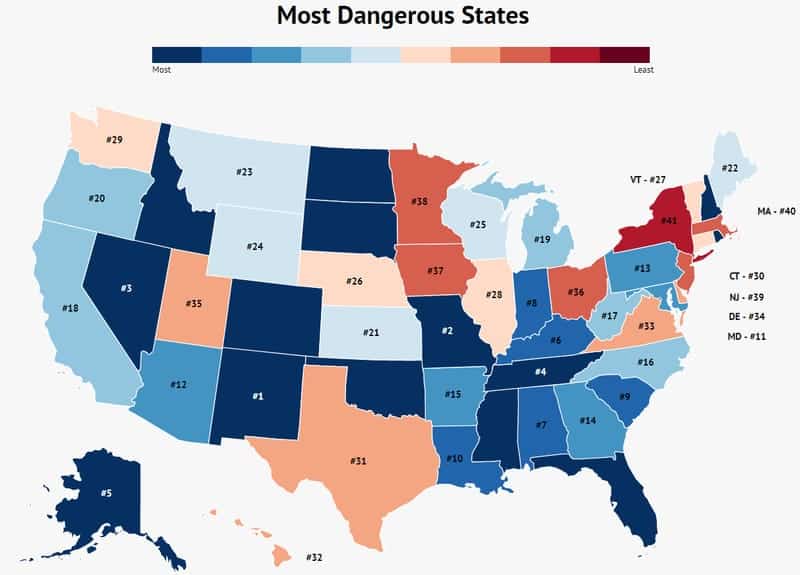
Have you ever considered the dangers associated with your job, your commute, or even daily activities in certain areas? If you haven’t, that’s a fortunate position to be in. For those who are aware of these risks, we’ve compiled a list ranking the states in the U.S. based on their safety levels. This information is vital for anyone looking to relocate or assess risks in their current state.
The 10 Most Dangerous States
These states may have previously seemed perfectly safe, but their current rankings highlight significant concerns. Let’s explore what factors contribute to their dangerous reputations.
How We Determined the Most Dangerous States
We analyzed three key factors to identify the most dangerous states:
- Workplace injuries and illnesses reported by OSHA—higher accident rates indicate greater danger
- Traffic deaths per 10,000 motor vehicles—more fatalities suggest higher risk on the roads
- Murder rates per 100,000 inhabitants annually—increasing murder rates correlate with increased danger
Essentially, we seek to answer the question: Am I safe at work, on the road, and in my daily life? The more injuries and deaths reported, the more perilous the state.
States such as Colorado, Florida, Idaho, Mississippi, New Hampshire, North Dakota, Oklahoma, Rhode Island, and South Dakota were omitted from consideration due to insufficient OSHA data, which in itself is a cause for concern.
1. New Mexico

Murder Rates: 8
Traffic Deaths: 2.1
Workplace Injuries: 2.8
Currently, New Mexico ranks as the most dangerous state in the U.S., with a high number of traffic fatalities (2.1 per 10,000 motor vehicles) and an alarming murder rate of 8 per 100,000 residents annually.
2. Missouri

Murder Rates: 9.9
Traffic Deaths: 1.7
Workplace Injuries: 2.8
Missouri ranks second, with a staggering murder rate of 9.9 per 100,000 residents each year, making it one of the most perilous states.
3. Nevada

Murder Rates: 6.7
Traffic Deaths: 1.3
Workplace Injuries: 3.5
Nevada records a significantly high rate of workplace injuries at 3.5 per year, indicating that job safety can be a major concern here.
4. Tennessee

Murder Rates: 7.4
Traffic Deaths: 1.8
Workplace Injuries: 2.8
While Tennessee has a comparatively lower number of workplace injuries, its murder rate and traffic deaths (1.8 per 10,000 motor vehicles) contribute to its dangerous reputation.
5. Alaska

Murder Rates: 8.2
Traffic Deaths: 1.0
Workplace Injuries: 3.6
Despite its low traffic death rate of 1.0, Alaska’s high murder rate of 8.2 places it among the top five most dangerous states.
6. Kentucky

Murder Rates: 5.5
Traffic Deaths: 1.7
Workplace Injuries: 3.2
Kentucky’s alarming rate of traffic deaths at 1.7 per 10,000 motor vehicles ties it with Alaska as the fifth most dangerous state.
7. Alabama

Murder Rates: 7.8
Traffic Deaths: 1.8
Workplace Injuries: 2.7
Alabama’s high murder rate of 7.8 per 100,000 residents positions it as the fourth most dangerous state, despite a lower number of workplace injuries.
8. Indiana

Murder Rates: 6.5
Traffic Deaths: 1.4
Workplace Injuries: 3.2
Indiana’s high incidence of workplace injuries at 3.2 reflects the risks associated with various job environments in the state.
9. South Carolina

Murder Rates: 7.7
Traffic Deaths: 2.3
Workplace Injuries: 2.4
South Carolina leads the nation with the highest number of traffic deaths at 2.3 per 10,000 motor vehicles, contributing significantly to its dangerous ranking.
10. Louisiana

Murder Rates: 11.4
Traffic Deaths: 2.0
Workplace Injuries: 1.8
Louisiana ranks tenth, with the highest murder rate in the U.S. at 11.4, although its workplace injuries rate appears relatively low.
Summary of the Most Dangerous States
While this list may seem alarming, it’s important to recognize that other health risks, such as heart disease and cancer, are far more prevalent causes of death. Thus, while caution is advisable when navigating these states, this information shouldn’t deter you from visiting or living in them. If your state didn’t make it into the top ten, congratulations are in order! Below is a detailed overview of the safety rankings for each state.
The Most Dangerous States
| Rank | State | Murders | Traffic Deaths | Workplace Injuries |
|---|---|---|---|---|
| 1 | New Mexico | 8 | 2 | 2 |
| 2 | Missouri | 9 | 1 | 2 |
| 3 | Nevada | 6 | 1 | 3 |
| 4 | Tennessee | 7 | 1 | 2 |
| 5 | Alaska | 8 | 1 | 3 |
| 6 | Kentucky | 5 | 1 | 3 |
| 7 | Alabama | 7 | 1 | 2 |
| 8 | Indiana | 6 | 1 | 3 |
| 9 | South Carolina | 7 | 2 | 2 |
| 10 | Louisiana | 11 | 2 | 1 |
| 11 | Maryland | 8 | 1 | 2 |
| 12 | Arizona | 5 | 1 | 3 |
| 13 | Pennsylvania | 6 | 1 | 3 |
| 14 | Georgia | 6 | 1 | 2 |
| 15 | Arkansas | 7 | 1 | 2 |
| 16 | North Carolina | 6 | 1 | 2 |
| 17 | West Virginia | 3 | 1 | 3 |
| 18 | California | 4 | 1 | 3 |
| 18 | Michigan | 5 | 1 | 3 |
| 20 | Oregon | 2 | 1 | 3 |
| 21 | Kansas | 3 | 1 | 3 |
| 22 | Maine | 1 | 1 | 4 |
| 22 | Montana | 3 | 1 | 3 |
| 24 | Wyoming | 2 | 1 | 3 |
| 25 | Wisconsin | 3 | 1 | 3 |
| 25 | Nebraska | 2 | 1 | 3 |
| 27 | Vermont | 1 | 1 | 4 |
| 28 | Illinois | 6 | 1 | 2 |
| 29 | Washington | 3 | 0.08 | 4 |
| 30 | Connecticut | 2 | 1 | 3 |
| 31 | Texas | 4 | 1 | 2 |
| 32 | Hawaii | 2 | 0.09 | 3 |
| 33 | Virginia | 4 | 1 | 2 |
| 33 | Delaware | 5 | 1 | 2 |
| 35 | Utah | 1 | 1 | 2 |
| 35 | Ohio | 4 | 1 | 2 |
| 37 | Iowa | 1 | 0.09 | 3 |
| 38 | Minnesota | 1 | 0.07 | 3 |
| 39 | New Jersey | 3 | 0.09 | 2 |
| 40 | Massachusetts | 2 | 0.07 | 2 |
| 41 | New York | 2 | 0.08 | 2 |
Author
Amanda Postma is a writer for the Zippia Career Advice blog with a focus on creating entertaining content to help you through your job search. She received her BA from the University Of Missouri-Columbia.