- Industry Statistics
- Wedding Industry Statistics
- Yoga Industry Statistics
- Music Industry Statistics
- Landscaping Industry Statistics
- Bicycle Industry Statistics
- Coffee Industry Statistics
- Car Rental Industry Statistics
- Home Improvement Industry Statistics
- Insurance Industry Statistics
- Supplements Industry Statistics
- Golf Industry Statistics
- Fitness Industry Statistics
- US Media And Entertainment Industry Statistics
- Firearm Industry Statistics
- Financial Services Industry Statistics
- Health And Wellness Industry Statistics
- Trucking Industry Statistics
- Wine Industry Statistics
- Pet Industry Statistics
- Mobile App Industry Statistics
- Digital Marketing Industry Statistics
- Hotel Industry Statistics
- Retail Statistics
- Robotics Industry Statistics
- Jewelry Industry Statistics
- Appointment Scheduling statistics
- Restaurant Industry Statistics
- Food Delivery Statistics
- Food Truck Industry
- Fashion Industry
- Real Estate Industry
- US Film Industry
- US Beverage Industry
- USu202fFast Food Restaurants
- US Construction Industry
- US Book Industry
- Cosmetics Industry
- US Food Retail Industry
- US Pharmaceutical Industry
- US Healthcare Industry
- Airline Industry
- Automobile Industry
- Transportation Industry Statistics
- Event Industry Statistics
- Project Management Statistics
- Oil And Gas Industry Statistics
- Nursing Home Statistics
- Nursing Shortage Statistics
- Nursing Statistics
30+ Home Improvement Industry Statistics [2026]: Trends, Spending, and Growth
Research Summary. The home improvement industry has continued to flourish in recent years, driven by evolving consumer preferences and increased investment in property enhancements. Below are key statistics reflecting the current state of the home improvement sector:
-
Americans spent $620 billion at home improvement stores in 2025.
-
58% of U.S. homes were built before 1980.
-
75% of American homeowners undertook a home improvement project in 2021.
-
The U.S. remodeling industry generated $1.3 trillion in revenue in 2025.
-
The U.S. home remodeling sector is projected to see a CAGR of 4.1% from 2021 to 2027.
For further insights, we have categorized the data into the following sections:
Trends and Projections | Consumer Spending | Types of Projects | Consumer Behavior | Home Improvement Companies

General Home Improvement Industry Statistics
-
92% of homes in the U.S. were built before the year 2000.
-
The global home improvement market value reached $763 billion in 2020.
-
From 2020 to 2027, the global home improvement industry is anticipated to achieve a CAGR of over 4%, pushing market value beyond $1 trillion by 2027.
Home Improvement Industry Trends and Projections
-
The U.S. home improvement market grew from $269.9 billion in 2010 to $620 billion in 2025.
The market has shown consistent annual growth, with a remarkable increase of over $90 billion from 2019 to 2020.
-
The U.S. home remodeling sector is projected to experience a 4.1% CAGR through 2027.
Factors such as the integration of smart home technology and increasing demand from rental property owners contribute to this growth.
-
Homeowners completed an average of 3.7 home improvement projects in 2021, a slight increase from previous years.
The average project cost was approximately $2,800.
Home Improvement Industry Statistics by Consumer Spending
-
8% of American homeowners planned to invest over $10,000 in home improvement projects in 2021.
-
14% of homeowners expected to spend between $5,000 and $10,000 in 2021.
-
As of 2018, the average homeowner spent $7,560 annually on home improvements.
-
In 2021, the average amount homeowners spent on home improvement projects increased to $10,341, marking a 25% rise from the previous year.
-
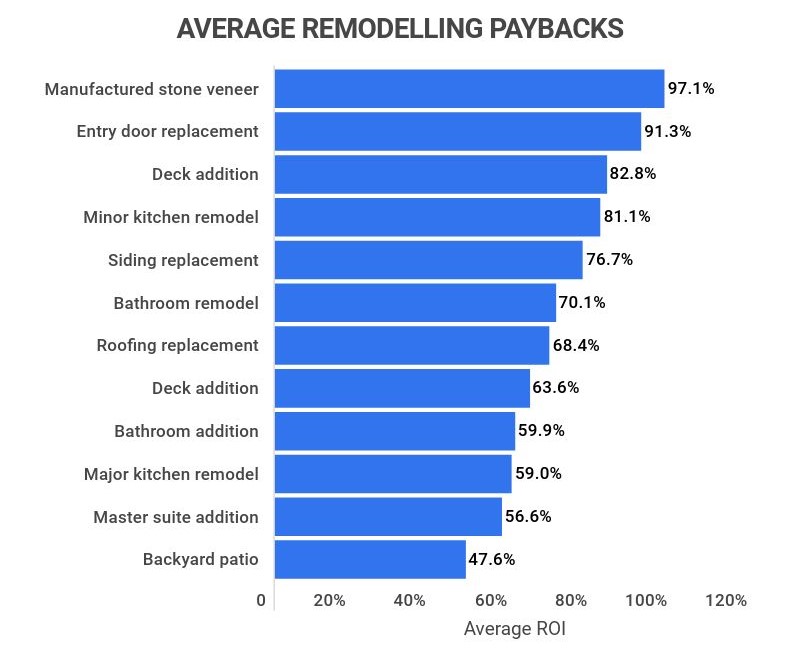
A typical remodeling project enhances a home’s resale value by an average of 56% of the remodel’s cost, although this can vary greatly by project type.
Home Improvement Industry Statistics by Types of Projects
-
84% of homeowners planned to tackle heating and cooling projects in 2022.
This trend reflects the ongoing need for efficient climate control systems, particularly in regions with extreme weather.
-
35% of homeowners intended to undertake yard or landscape projects in 2021.
31% focused on bathroom upgrades, while 27% aimed to enhance their kitchens, and 26% planned bedroom renovations.
-
The average cost of a minor kitchen remodel is estimated at $22,500 as of 2025.
A major remodel can range from $48,000 to $90,000 when hiring professional designers. Note that these figures reflect post-pandemic price adjustments.
-
56% of homeowners upgraded their outdoor spaces in 2021.
This trend has continued to rise since 2018, indicating a preference for enhanced outdoor living spaces.
2015 2016 2017 2018 2019 2020 Interior Room Remodels 72% 72% 72% 72% 70% 68% Home System Upgrades 61% 62% 64% 65% 62% 61% Outdoor Upgrades 54% 53% 53% 50% 56% 57% Home Exterior Upgrades 58% 57% 59% 59% 57% 56% Additions 9% 9% 9% 8% 8% 8% 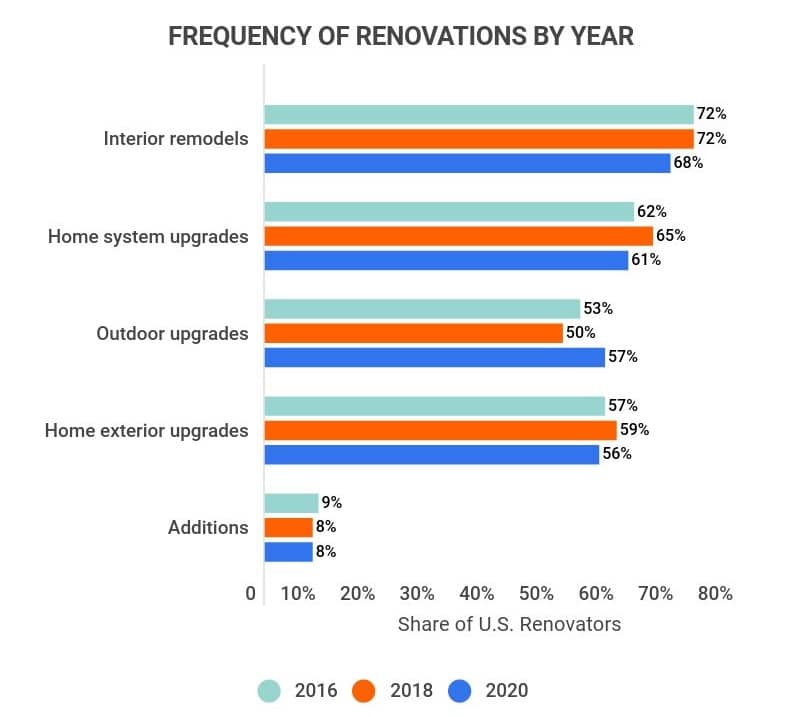
-
35% of homeowners painted their interior walls in 2020.
This project remained popular into 2021, alongside bathroom remodels and smart home installations.
-
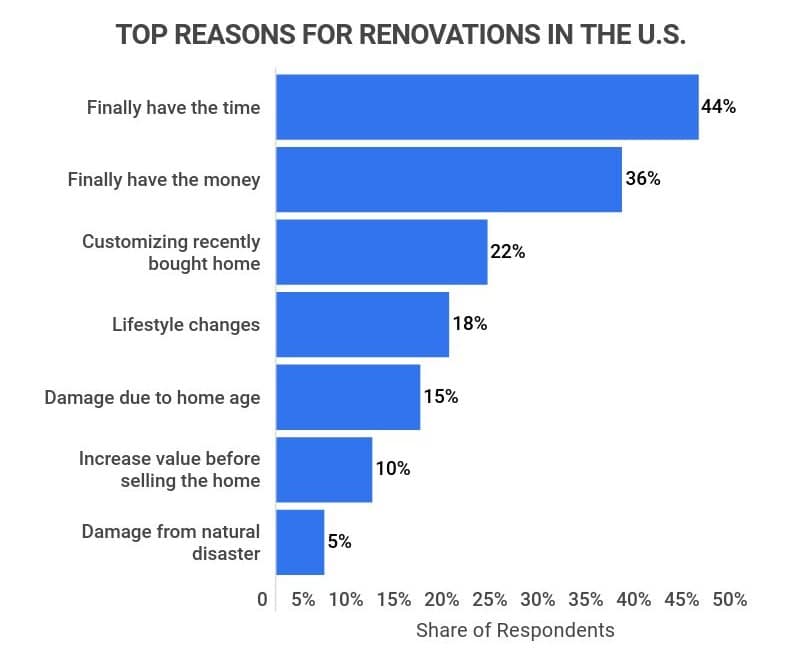
44% of homeowners who renovated in 2020 did so because they finally had the time and resources.
Others cited customization for new homes or adapting to lifestyle changes as key motivations.
-
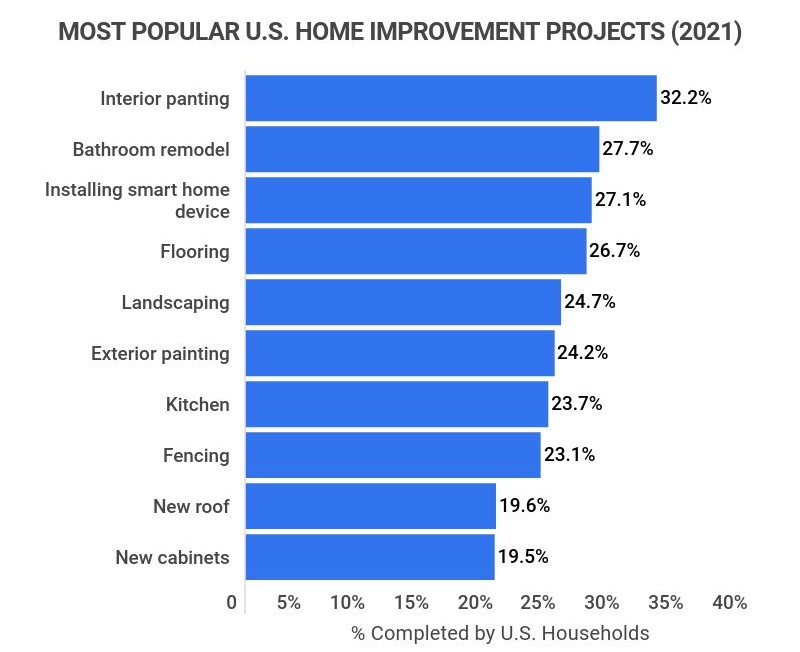
In 2021, the most popular home improvement projects included painting interiors, bathroom remodels, and smart device installations.
Specifically, 32% of homeowners painted interiors, 28% remodeled bathrooms, and 27% installed smart devices.
Home Improvement Industry Statistics by Consumer Behavior
-
91% of homeowners report that their homes require either minor or major renovations.
-
76% of U.S. homeowners undertook at least one home improvement project during the recent years.
-
52% of homeowners who completed projects in 2020 were Baby Boomers.
-
32% were Generation X homeowners, while Millennials accounted for 12%.
-
50% of homeowners opt to tackle their projects themselves.
-
56% of homeowners intended to hire professionals for all or part of their projects in 2021.
Home Improvement Industry Statistics by Home Improvement Companies
-
Home Depot, Lowe’s Home Improvement, and Ferguson remain the leading home improvement companies in the U.S. by revenue.
Below is an overview of each company’s annual revenue:
Top Home Improvement Companies in the U.S. and Their Annual Revenue
Company Annual Revenue Home Depot $153 billion Lowe’s Home Improvement $96 billion Ferguson $36 billion Sherwin Williams, Tractor Supply Co., and ABC Supply follow closely in size.
-
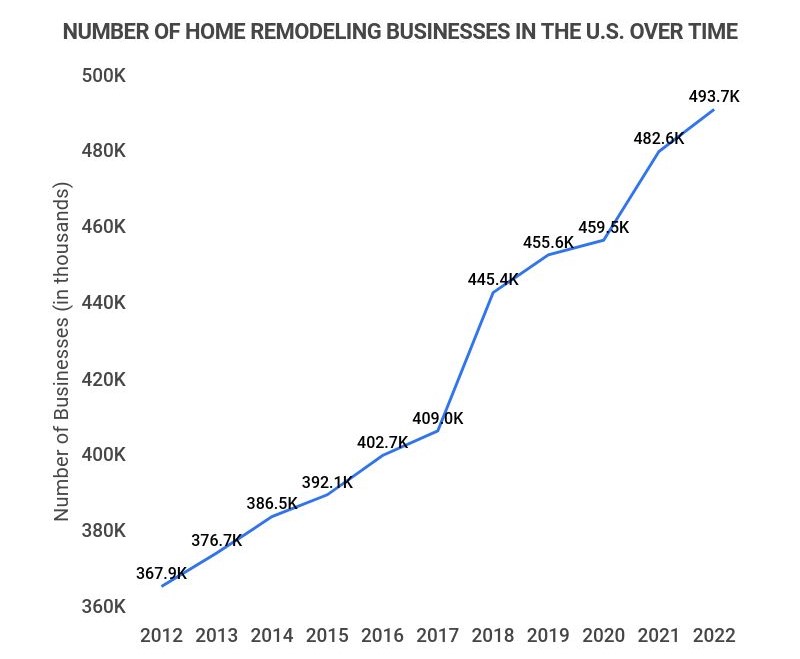
As of 2026, there are approximately 600,000 remodeling businesses operating in the U.S.
This reflects a growth trend of around 2.6% annually from 2018 to 2026.
-
U.S. home improvement sales reached $620 billion in 2025.
This figure is projected to continue its upward trajectory through 2027.
Home Improvement Industry Statistics FAQ
-
How big is the home improvement industry?
The global home improvement industry is valued at $763 billion, with the U.S. market contributing $620 billion. While these figures stem from different years, they underscore the U.S.’s pivotal role in the global landscape.
The international home improvement market is expected to grow at a CAGR of 4% from 2020 to 2027, potentially exceeding $1 trillion by 2027.
-
Is the home improvement industry growing?
Yes, the home improvement industry is witnessing significant growth. The rise in remodeling businesses indicates this trend, with an average increase of 2.6% annually from 2018 to 2026.
Home improvement sales reached $620 billion in 2025, with further increases expected in the coming years.
-
How often do Americans renovate their homes?
Americans typically renovate their homes every three to five years. Minor updates, such as painting, are common, while major renovations occur less frequently.
-
How many home improvement contractors are there in the U.S.?
There are over 6,200 home improvement contractors in the U.S. Most are men, and salaries range from $35,233 to $63,000 annually.
-
What is trending in home improvement?
Smart home installations are increasingly popular. The trend continues to grow alongside traditional projects like interior painting and bathroom remodels.
-
Why is the home improvement industry growing?
The industry growth is fueled by evolving consumer preferences and increased time spent at home. Homeowners are investing more in their properties, driven by lifestyle changes and technology integration.
Conclusion
As of 2025, the home improvement industry continues to thrive, with Americans investing $620 billion in home improvement initiatives. This trend reflects a robust market poised for further growth, as the global home improvement sector is expected to exceed $1 trillion by 2027.
Homeowners are increasingly focused on renovations that enhance their living spaces, with popular projects including interior painting, bathroom remodels, and smart home installations.
References
-
Statista. “Home Improvement Market Size in the United States From 2008 to 2025.” Accessed on April 7, 2022.
-
Old House Web. “How Old Are America’s Houses? The Surprising Results of Our Old House Poll.” Accessed on April 7, 2022.
-
Statista. “Worldwide Home Improvement Market Value From 2020 to 2027.” Accessed on April 7, 2022.
-
Global Market Insights. “Industry Trends: U.S. Home Remodeling Market.” Accessed on April 7, 2022.
-
Angi. “State of Home Spending.” Accessed on April 7, 2022.
-
Family Handyman. “Which Home Improvement Projects Are Most Popular in 2021?” Accessed on April 7, 2022.
-
Statista. “Average Annual Home Improvement Spend Per Homeowner in the United States From 2014 to 2018 (in U.S. Dollars).” Accessed on April 7, 2022.
-
CNBC. “Here’s How Much Your Home Remodel Will Pay You Back.” Accessed on April 7, 2022.
-
NerdWallet. “What a Kitchen Remodel Costs – and Ways to Save.” Accessed on April 7, 2022.
-
Statista. “Frequency of Renovations Among Homeowners Who Renovated in the United States From 2015 to 2020.” Accessed on April 7, 2022.
-
Statista. “Top Home Service Projects in the United States in 2020, by Share of Households.” Accessed on April 7, 2022.
-
Statista. “Frequency of Top Renovations Triggers Among U.S. Homeowners Who Renovated in 2020.” Accessed on April 7, 2022.
-
Statista. “Home Improvement Trends During the Coronavirus Outbreak in the United States in 2020.” Accessed on April 7, 2022.
-
Statista. “Share of Homeowners Who Renovated in the United States in 2020, by Generation.” Accessed on April 7, 2022.
-
Datanyze. “Top Home Improvement and Hardware Retail Companies.” Accessed on April 7, 2022.
-
IBISWorld. “Remodeling in the U.S. – Number of Businesses 2003-2027.” Accessed on April 7, 2022.
-
Property Management. “Home Improvement Industry Statistics.” Accessed on April 7, 2022.
-
Zippia. “Home Improvement Contractor Demographics and Statistics in the U.S.” Accessed on April 7, 2022.
-
IBISWorld. “Remodeling in the U.S. – Number of Businesses 2004-2029.” Accessed on March 12, 2023.
- Industry Statistics
- Wedding Industry Statistics
- Yoga Industry Statistics
- Music Industry Statistics
- Landscaping Industry Statistics
- Bicycle Industry Statistics
- Coffee Industry Statistics
- Car Rental Industry Statistics
- Home Improvement Industry Statistics
- Insurance Industry Statistics
- Supplements Industry Statistics
- Golf Industry Statistics
- Fitness Industry Statistics
- US Media And Entertainment Industry Statistics
- Firearm Industry Statistics
- Financial Services Industry Statistics
- Health And Wellness Industry Statistics
- Trucking Industry Statistics
- Wine Industry Statistics
- Pet Industry Statistics
- Mobile App Industry Statistics
- Digital Marketing Industry Statistics
- Hotel Industry Statistics
- Retail Statistics
- Robotics Industry Statistics
- Jewelry Industry Statistics
- Appointment Scheduling statistics
- Restaurant Industry Statistics
- Food Delivery Statistics
- Food Truck Industry
- Fashion Industry
- Real Estate Industry
- US Film Industry
- US Beverage Industry
- USu202fFast Food Restaurants
- US Construction Industry
- US Book Industry
- Cosmetics Industry
- US Food Retail Industry
- US Pharmaceutical Industry
- US Healthcare Industry
- Airline Industry
- Automobile Industry
- Transportation Industry Statistics
- Event Industry Statistics
- Project Management Statistics
- Oil And Gas Industry Statistics
- Nursing Home Statistics
- Nursing Shortage Statistics
- Nursing Statistics
Author
Jack Flynn is a writer for Zippia. In his professional career he’s written over 100 research papers, articles and blog posts. Some of his most popular published works include his writing about economic terms and research into job classifications. Jack received his BS from Hampshire College.