Find a Job You Really Want In
The Most Common Ancestry in Every State: A 2026 Perspective
The United States continues to thrive as a vibrant tapestry of cultures and ethnicities. With a population that comprises individuals from various national backgrounds, the richness of American heritage is evident across the nation. However, the distribution of these ancestries varies significantly from state to state, reflecting historical immigration patterns, economic opportunities, and demographic shifts.
Using the latest data from the American Community Survey (ACS), we have identified the three most common ancestries reported in each state. Continue reading to discover our key findings and insights into the diverse backgrounds that shape America today.
Key Findings on Most Common Ancestry
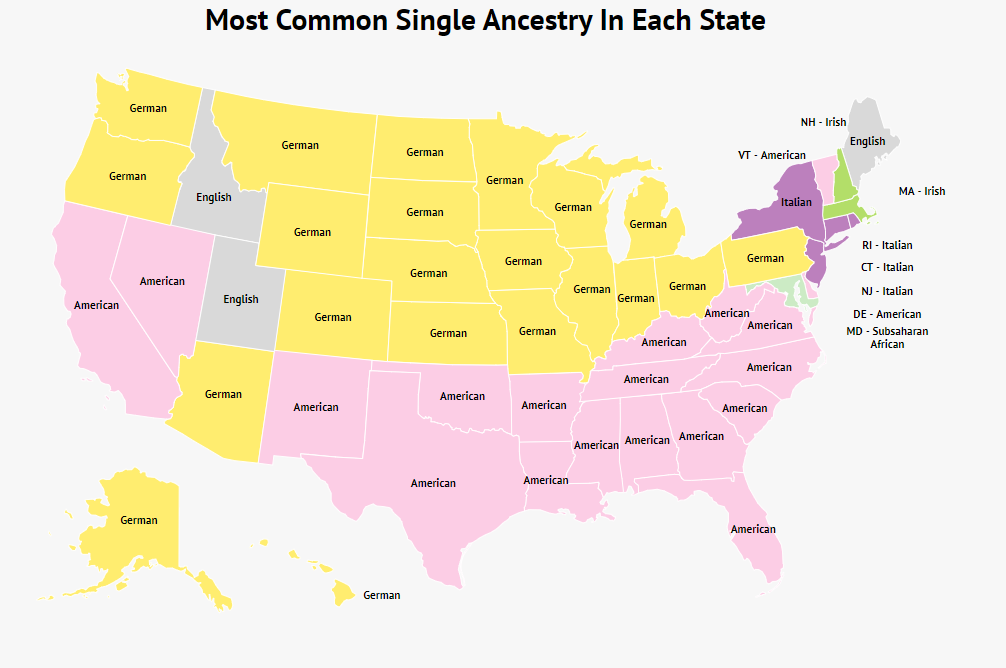
- The predominant ancestry in the U.S. remains German, with over 50 million Americans of German descent, marking it as the primary heritage in 21 states.
- Historically, German was the second most spoken language in America before World War I, highlighting its significant cultural influence.
- German is still the second most spoken language in North Dakota.
- 19 states list “American” as their most common ancestry, reflecting a complex identity shaped by various heritages.
- Massachusetts and New Hampshire have notable Irish populations, especially during St. Patrick’s Day celebrations.
- Only Maryland claims Sub-Saharan African ancestry as its most prevalent identity.
Second Most Common Ancestry in Each State
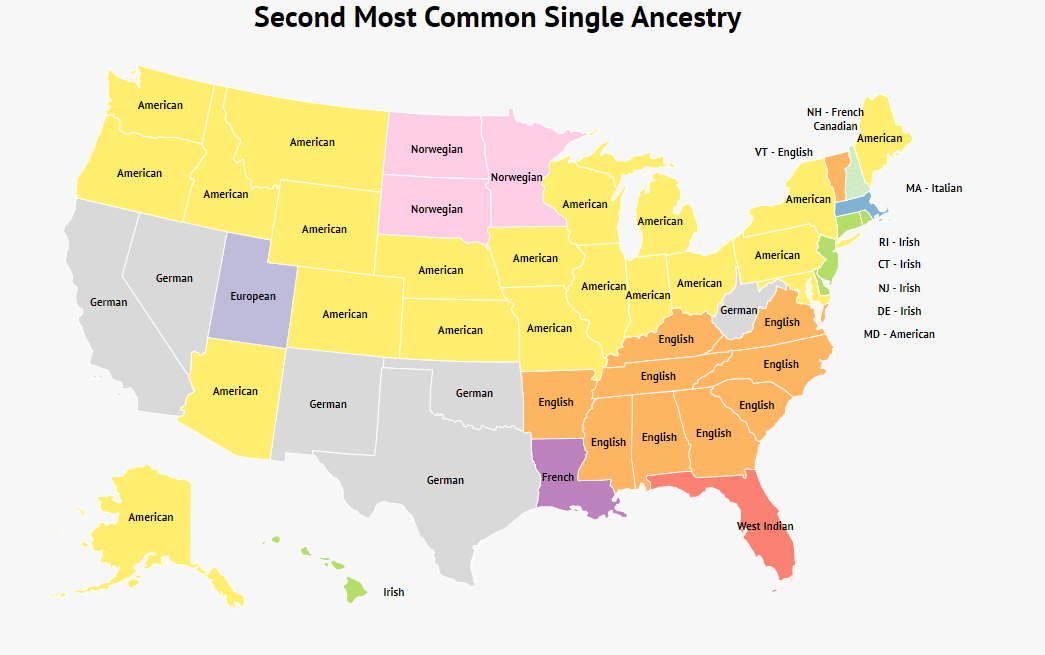
- “American” remains a frequent response as a second ancestry.
- Ten states report English as the second most common primary ancestry, primarily in the South.
- In Louisiana, the French legacy is evident, reflecting its rich cultural history.
- Norwegian ancestry ranks as the second most common in Minnesota, North Dakota, and South Dakota.
- For the first time, West Indian ancestry appears as the second most common in Florida.
Third Most Common Ancestry in Each State
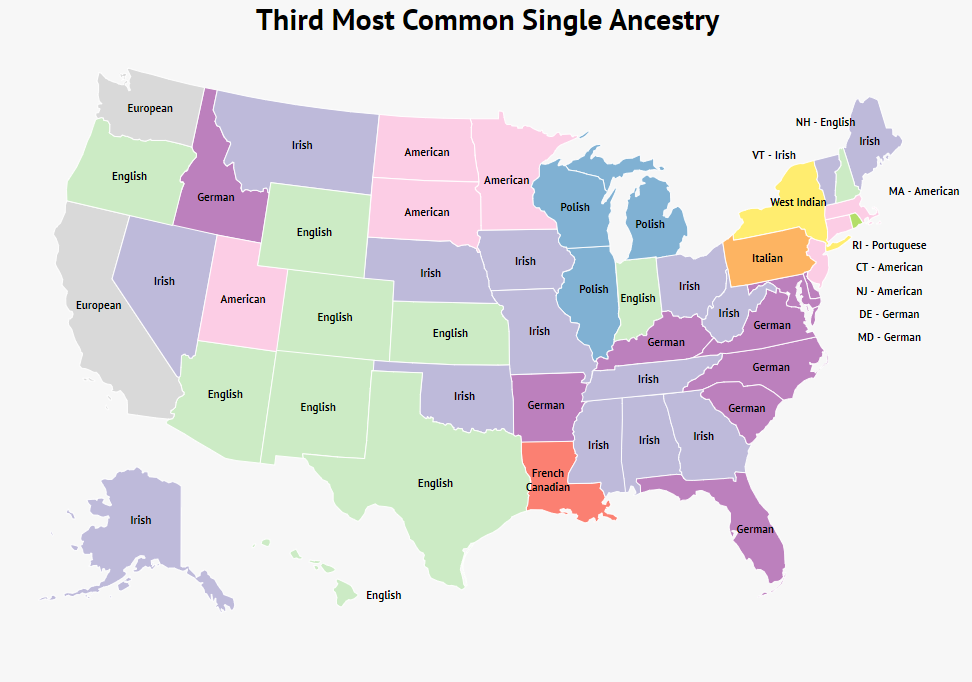
- The third most common ancestries often reflect familiar heritages, such as Irish, English, German, and American.
- Portuguese ancestry ranks third in Rhode Island.
- Michigan, Wisconsin, and Illinois identify Polish as their third most common heritage.
How We Determined This
To uncover the most common ancestries within each state, we analyzed data from the U.S. Census Bureau’s Ancestry records. We identified the single ancestry with the highest number of self-reported residents, subsequently determining the second and third highest ancestries.
It’s important to note that this data relies on self-reporting, which may be influenced by individuals’ knowledge of their heritage. Given that a significant portion of Americans can’t accurately name all their great-grandparents, these findings may reflect some discrepancies.
This phenomenon might explain the high number of respondents identifying as “American,” as many may have lost touch with their more distant ancestral lines.
Furthermore, the data focuses on individuals reporting a single ancestry, not accounting for the many who possess a diverse mix of backgrounds.
Below, you can explore a table displaying the three most common single ancestries in each state:
Most Common Ancestries
| State | First | Second | Third |
|---|---|---|---|
| Alabama | American | English | Irish |
| Alaska | German | American | Irish |
| Arizona | German | American | English |
| Arkansas | American | English | German |
| California | American | German | European |
| Colorado | German | American | English |
| Connecticut | Italian | Irish | American |
| Delaware | American | Irish | German |
| Florida | American | West Indian | German |
| Georgia | American | English | Irish |
| Hawaii | German | Irish | English |
| Idaho | English | American | German |
| Illinois | German | American | Polish |
| Indiana | German | American | English |
| Iowa | German | American | Irish |
| Kansas | German | American | English |
| Kentucky | American | English | German |
| Louisiana | American | French | French Canadian |
| Maine | English | American | Irish |
| Maryland | Sub-Saharan African | American | German |
| Massachusetts | Irish | Italian | American |
| Michigan | German | American | Polish |
| Minnesota | German | Norwegian | American |
| Mississippi | American | English | Irish |
| Missouri | German | American | Irish |
| Montana | German | American | Irish |
| Nebraska | German | American | Irish |
| Nevada | American | German | Irish |
| New Hampshire | Irish | French Canadian | English |
| New Jersey | Italian | Irish | American |
| New Mexico | American | German | English |
| New York | Italian | American | West Indian |
| North Carolina | American | English | German |
| North Dakota | German | Norwegian | American |
| Ohio | German | American | Irish |
| Oklahoma | American | German | Irish |
| Oregon | German | American | English |
| Pennsylvania | German | American | Italian |
| Rhode Island | Italian | Irish | Portuguese |
| South Carolina | American | English | German |
| South Dakota | German | Norwegian | American |
| Tennessee | American | English | Irish |
| Texas | American | German | English |
| Utah | English | European | American |
| Vermont | American | English | Irish |
| Virginia | American | English | German |
| Washington | German | American | European |
| West Virginia | American | German | Irish |
| Wisconsin | German | American | Polish |
| Wyoming | German | American | English |
Author
Kathy is the head of content at Zippia with a knack for engaging audiences. Prior to joining Zippia, Kathy worked at Gateway Blend growing audiences across diverse brands. She graduated from Troy University with a degree in Social Science Education.