- Business Statistics
- Startup Statistics
- Cloud Adoption Statistics
- Customer Loyalty Statistics
- Nonprofit Statistics
- Affiliate Marketing Statistics
- Cart Abandonment Rate Statistics
- Ridesharing Statistics
- Call Center Statistics
- eLearning statistics
- Customer Service Statistics
- Customer Experience statistics
- Entrepreneur Statistics
- Outsourcing Statistics
- Gross Revenue for Marketing and Advertising
- Sales Statistics
- MBA Statistics
- Average Small Business Revenue + Profit Margin
- How Much Do Employee Benefits Cost?
Research Summary. Nonprofit organizations play a crucial role in providing essential services for various causes, employing millions of Americans and contributing significantly to the U.S. economy. Over the past decade, the revenue generated by these organizations has seen remarkable growth, reflecting their increasing importance and resilience.
-
There are 1.5 million nonprofit organizations operating in the United States.
-
Nonprofits employ 10% of the U.S. workforce.
-
Globally, nonprofits account for 7.4% of the workforce.
-
70% of the personnel at international nonprofits are paid employees, with 29% serving as volunteers.
-
Nonprofits contribute 5.7% to the United States GDP.
-
Annual revenue for U.S. nonprofits totals $2.62 trillion.
For further insights, we have categorized the data as follows:
Donations | Revenue | Trends and Projections

General Nonprofit Statistics
-
The nonprofit sector ranks as the 3rd largest workforce in the United States, following retail and manufacturing.
-
As of the third quarter of 2026, the nonprofit sector contributed an estimated $1.5 trillion to the U.S. economy.
-
The nonprofit sector represents 5.7% of the U.S. GDP.
-
Globally, there are over 10 million nonprofit organizations.
Nonprofit Statistics By Donations
-
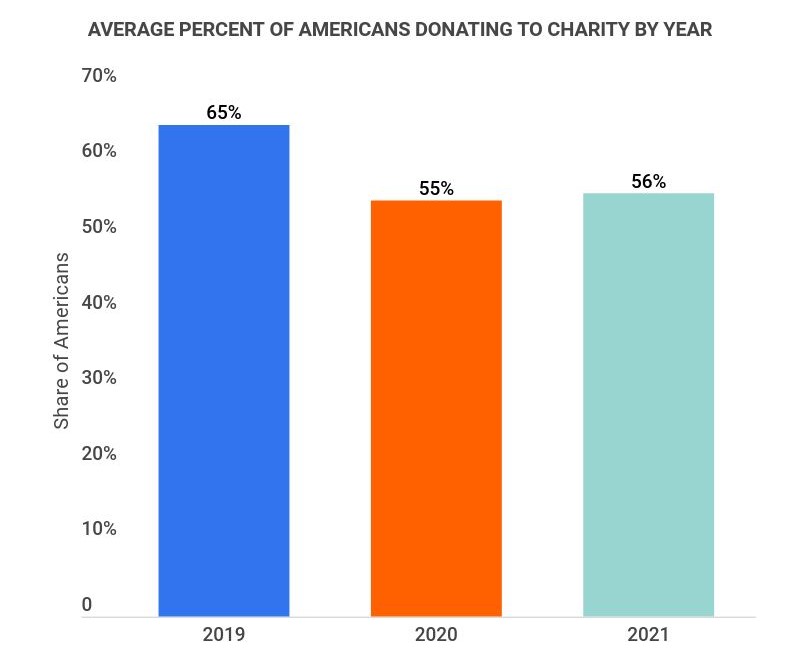
56% of Americans donated to charity in 2021.
This marks a 1% increase from pre-pandemic levels of charitable giving. Individuals aged 56 to 75 are the most generous, with 60% of baby boomers contributing to charity. However, Gen Z is catching up, with 57% of those aged 18 to 24 donating to charitable causes.
-
45% of global charitable donors participate in monthly giving programs.
This indicates a significant willingness among individuals to commit to regular financial support for charitable causes.
-
Approximately 10% of total nonprofit revenue is generated from individual donations.
Conversely, 80% of the revenue for U.S. nonprofits arises from government grants or contracts, with 4% coming from foundations.
-
Donors report an ability to give up to 20% more due to potential capital gains tax elimination.
This is relevant considering that 89% of wealth is held in non-cash assets.
-
The average age of charitable donors in the U.S. is 64 years.
Typically, this demographic makes two charitable contributions annually.
-
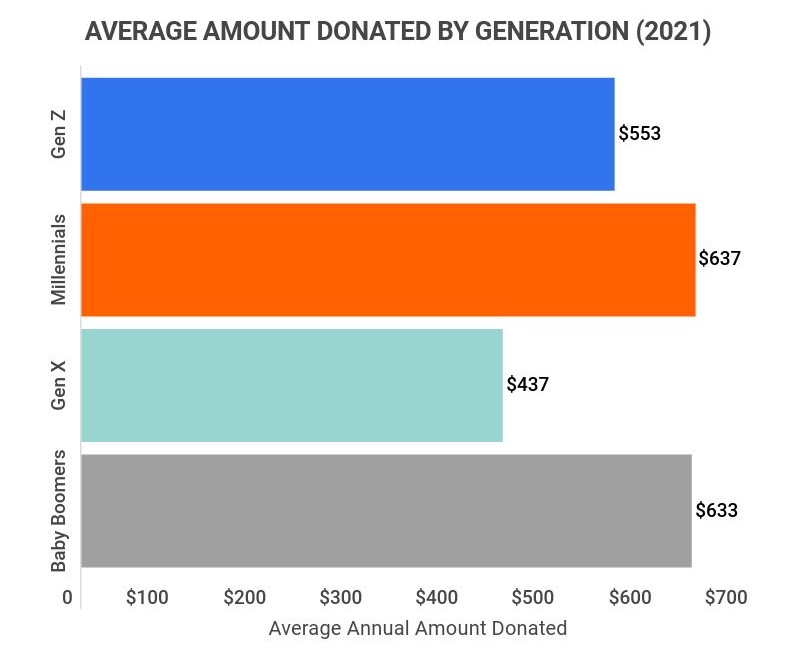
In 2021, the average charitable donation was $574.
The leading cause for donations that year was food banks, followed by religious organizations, animal welfare, pandemic recovery efforts, and racial equity initiatives.
Nonprofit Statistics By Revenue
-
80% of all nonprofit revenue is derived from government grants.
-
In 2017, email marketing and promotional campaigns accounted for 28% of all nonprofit revenue.
-
The total revenue of nonprofits in the United States was $2.62 trillion as of 2016, reflecting a significant doubling over the past decade.
Nonprofit Statistics By Trends and Projections
-
Online giving to nonprofits experienced a 12.1% increase in 2021.
Donations for environmental and human rights causes saw the highest growth, with environmental contributions rising by 34% and human rights donations increasing by 37%.
-
Overall, nonprofit donations have shown a growth rate of 4.1% over the last year.
This marked 2021 as the sixth consecutive year of growth in U.S. nonprofit donations.
-
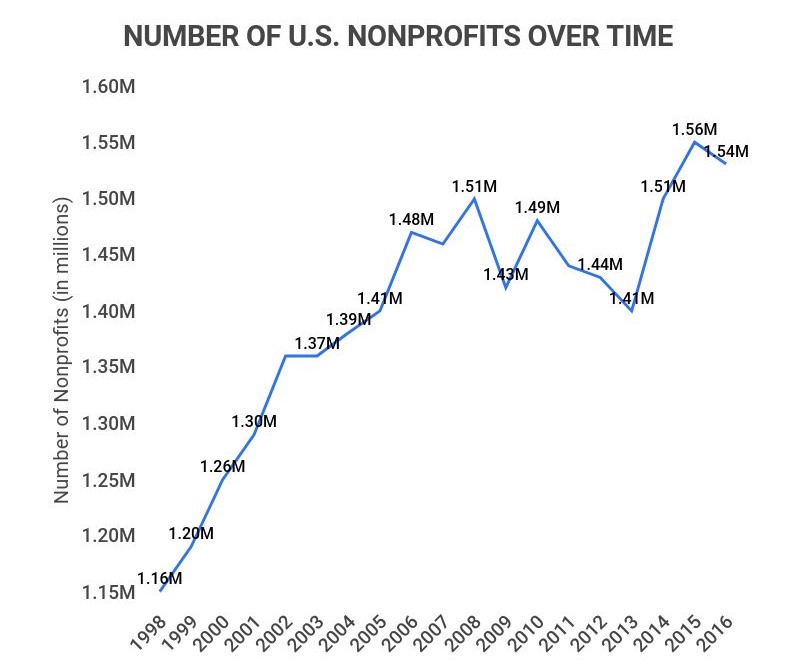
In 2000, there were 1.26 million nonprofits in the U.S. By 2016, this number grew to 1.54 million.
This translates to an average annual growth rate of 1.4% for U.S. nonprofits.
-
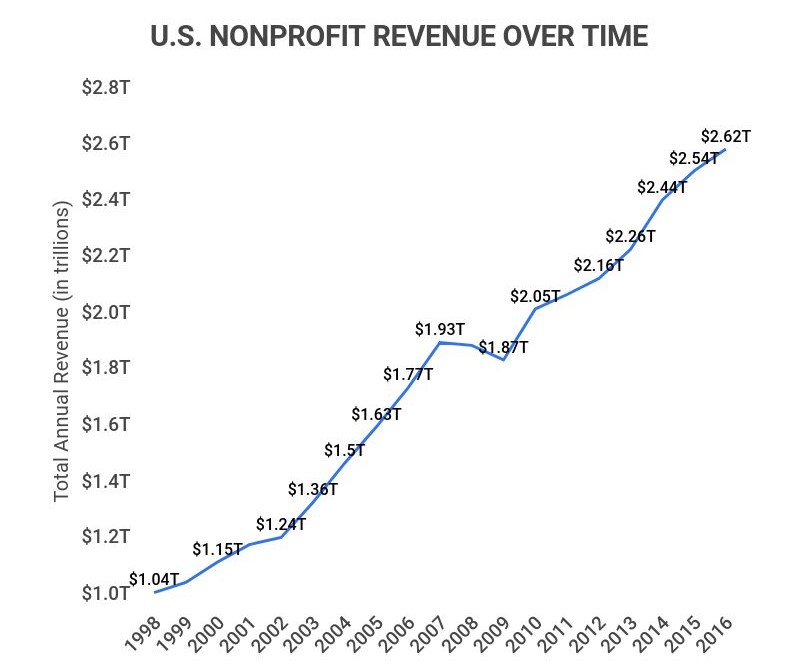
In 2000, the revenue for U.S. nonprofits stood at $1.15 trillion, which grew to $2.62 trillion by 2016.
This indicates a remarkable annual growth rate of 8.4% in nonprofit revenue, significantly outpacing the growth in the number of nonprofit organizations.
-
As of 2021, approximately 12.3 million jobs were generated by the U.S. nonprofit sector.
The District of Columbia has the highest percentage of nonprofit employment at 26%, while Nevada holds the lowest at 2.7%.
Nonprofit Employment By State
State Nonprofit as percent of total employment Total employment Nonprofit employment Vermont 18.8% 254,999 48,014 Maine 18.0% 508,104 91,369 New York 17.7% 7,782,407 1,380,931 Massachusetts 17.7% 3,065,883 542,279 Rhode Island 16.5% 414,410 68,348 North Dakota 15.7% 345,688 54,238 Pennsylvania 15.6% 5,062,672 790,368 New Hampshire 14.8% 562,809 83,453 Minnesota 14.8% 2,438,627 360,461 Montana 14.7% 370,994.0 54,388 South Dakota 14.6% 347,497 50,842 Connecticut 14.6% 1,435,521 209,356 West Virginia 14.0% 546,617 76,432 Alaska 13.5% 250,255 33,786 Maryland 12.8% 2,141,805 273,355 Ohio 12.2% 4,606,685 564,039 Oregon 12.2% 1,556,370 190,124 Wisconsin 11.9% 2,447,832 291,393 Delaware 11.9% 376,028 44,707 Hawaii 11.6% 525,124 61,057 Illinois 11.3% 5,112,176 577,876 Iowa 11.3% 1,302,244 146,935 Missouri 11.2% 2,340,176 261,914 Michigan 10.8% 3,686,126 397,128 Nebraska 10.7% 807,525 86,431 Indiana 10.0% 2,595,568 259,774 Washington 9.7% 2,669,295 259,427 New Jersey 9.6% 3,382,178 323,806 Kentucky 9.5% 1,566,813 149,597 Arkansas 9.2% 993,989 91,175 Virginia 9.0% 3,095,185 277,787 Kansas 8.4% 1,129,173 94,916 North Carolina 8.4% 3,565,929 298,462 New Mexico 8.2% 627,472 51,152 Arizona 8.1% 2,294,353 186,258 Louisiana 8.0% 1,599,363 128,721 Tennessee 8.0% 2,478,737 199,487 California 7.8% 14,288,358 1,112,268 Colorado 7.7% 2,146,791 165,311 Georgia 7.4% 3,619,899 268,612 Florida 7.2% 7,262,168 521,840 Idaho 7.1% 572,321 40,466 Oklahoma 6.7% 1,252,645 84,335 Utah 6.7% 1,165,414 78,235 Mississippi 6.4% 888,986 56,883 Wyoming 6.1% 205,040 12,527 South Carolina 5.4% 1,651,309 89,729 Alabama 5.3% 1,555,542 82,861 Texas 5.1% 9,960,249 506,744 Nevada 2.7% 1,132,119 30,943 -
64.4 million adults volunteered at nonprofits at least once in 2017, representing 25.1% of the U.S. population.
The volunteer rate slightly increased in 2017 compared to previous years, although the peak volunteering years were between 2009 and 2011 when 26.8% of the population engaged in volunteer work.
-
Research indicates that 45% of nonprofit employees plan to seek new jobs by 2025, highlighting significant burnout within the sector.
Key issues contributing to this trend include low compensation, limited opportunities for career advancement, and organizational management challenges. Notably, 25% of departing employees indicate they are unlikely to pursue new roles within the nonprofit sector, further emphasizing this trend.
Nonprofit Statistics FAQ
-
How many nonprofits are there in the United States?
There are over 1.5 million nonprofit organizations in the United States.
To put this in context, roughly 10 million nonprofits exist globally, meaning about 15% of the world’s nonprofits are based in the U.S.
-
Nonprofits represent 5.7% of the U.S. economy. Additionally, 10.2% of companies in the U.S. are classified as nonprofit organizations.
-
What percentage of nonprofits are successful?
Only about 50% of nonprofits achieve long-term success. According to the National Center for Charitable Statistics, around 30% of nonprofits fail to survive beyond ten years.
-
Do nonprofits actually make a profit?
Nonprofits do earn revenue, but their primary goal is not profit generation, which differentiates them from for-profit businesses. Nonprofits require funds to maintain operations, relying on donations while focusing on delivering essential services to the public rather than generating profit. Distributing earnings to private individuals is prohibited for nonprofits, ensuring their focus remains on public interest.
-
Are nonprofits considered in GDP?
Yes, nonprofits contribute to the U.S. GDP. They account for 5.7% of the total GDP.
-
What is the most recognized nonprofit organization?
Feeding America is the leading nonprofit organization, addressing domestic needs and receiving $4.06 billion in private donations in 2022. This is followed by United Way Worldwide ($2.77 billion), St. Jude Children’s Research Hospital ($2.34 billion), Salvation Army ($2.34 billion), and Direct Relief ($2.21 billion).
Most Popular Charities to Donate To 2022
Nonprofit name Private donations Total revenue Fundraising efficiency Charitable Commitment Feeding America $4.06B $4.21B 99% 99% United Way Worldwide $2.77B $3.89B 88% 85% St. Jude Children’s Research Hospital $2.34B $2.33B 85% 69% Salvation Army $2.34B $5.79B 90% 82% Direct Relief $2.21B $2.22B 100% 100% Good 360 $1.68B $1.69B 100% 100% Goodwill Industries International $1.44B $7.41B 99% 89% YMCA of the USA $1.41B $7.44B 90% 84% Habitat for Humanity International $1.27B $2.13B 88% 83% Americares $1.22B $1.24B 99% 98%
Conclusion
Nonprofit organizations in the United States are essential for promoting humanitarian causes and serving the community in various capacities, from food banks and homelessness support to medical research and animal welfare.
Over the years, the services provided by these organizations have become increasingly vital. Today, there are approximately 1.5 million registered nonprofit organizations in the United States, accounting for about 15% of global nonprofits.
Moreover, these organizations employ 10% of the U.S. workforce, translating to roughly 16 million individuals. This figure is significant, considering that nonprofits contribute 5.7% to the nation’s GDP.
Over the past two decades, the number of nonprofit organizations has grown at a steady rate of 1.4% annually. While this growth is respectable, it pales in comparison to the exponential rise in total nonprofit revenue. In 2000, U.S. nonprofit revenue was recorded at $1.15 trillion.
Nearly two decades later, by 2016, this figure had more than doubled, reaching $2.62 trillion. Given the current economic landscape, it is essential to consider how much revenue nonprofits are generating as we move into 2026.
Nonprofits are designed to prioritize community service over profit-making. However, they also manage substantial financial flows to achieve their missions effectively.
References
-
Candid Learning. How many nonprofit organizations are there in the US? | Knowledge base | Candid Learning. Accessed on March 14, 2022.
-
Independent Sector, The Charitable Sector. Accessed on March 14, 2022.
-
The Nonprofit Times. 7.4% Of World Workforce In Nonprofits. Accessed on March 14, 2022.
-
National Center for Charitable Statistics. The Nonprofit Sector in Brief 2019 | National Center for Charitable Statistics. Accessed on March 14, 2022.
-
Statistica. • US nonprofit organizations: revenues 2016 | Statista. Accessed on March 14, 2022.
-
Blackbaud Institute. Online Giving Trends – Blackbaud Institute. Accessed on March 14, 2022.
-
Philanthropy News Digest. Nonprofits Are America’s Third Largest Employer, Study Finds | Philanthropy news | PND. Accessed on March 14, 2022.
-
Foundation Group. 50 Nonprofit Facts and Statistics. Accessed on March 14, 2022.
-
LendingTree. 56% of Americans Donated to Charity in 2021, at an Average of $574. Accessed on March 14, 2022.
-
Double the Donation. Nonprofit Fundraising Statistics [Updated for 2022]. Accessed on March 14, 2022.
-
The Nonprofit Times. 80% Of Nonprofits’ Revenue Is From Government, Fee For Service. Accessed on March 14, 2022.
-
National Philanthropic Trust. Charitable Giving Statistics – NPTrust. Accessed on March 14, 2022.
-
Philanthropy News Digest. Online giving up more than 20 percent in 2020, report finds. Accessed on March 14, 2022.
-
Statistica. • US nonprofit organizations: number 2016 | Statista. Accessed on March 14, 2022.
-
BLS. Nonprofits account for 12.3 million jobs, 10.2 percent of private sector employment, in 2016: The Economics Daily: US Bureau of Labor Statistics. Accessed on March 14, 2022.
-
Nanoe. Nonprofits Fail – Here’s Seven Reasons Why. Accessed on March 14, 2022.
-
Forbes. America’s Top 100 Charities. Accessed on March 13, 2023.
-
Independent Sector. Health of the U.S. Nonprofit Sector Quarterly Review. Accessed on March 13, 2023.
-
Forbes. 45% Of Nonprofit Employees To Seek New Jobs By 2025: Report. Accessed on March 13, 2023.
- Business Statistics
- Startup Statistics
- Cloud Adoption Statistics
- Customer Loyalty Statistics
- Nonprofit Statistics
- Affiliate Marketing Statistics
- Cart Abandonment Rate Statistics
- Ridesharing Statistics
- Call Center Statistics
- eLearning statistics
- Customer Service Statistics
- Customer Experience statistics
- Entrepreneur Statistics
- Outsourcing Statistics
- Gross Revenue for Marketing and Advertising
- Sales Statistics
- MBA Statistics
- Average Small Business Revenue + Profit Margin
- How Much Do Employee Benefits Cost?
Author
Sky Ariella is a professional freelance writer, originally from New York. She has been featured on websites and online magazines covering topics in career, travel, and lifestyle. She received her BA in psychology from Hunter College.