Find a Job You Really Want In
As we reflect on over half a century since Martin Luther King Jr.’s iconic dream speech, it is evident that while progress has been made toward racial equality in America, significant disparities persist. The struggle for equity remains a daily reality for many Black Americans, who continue to face systemic discrimination, economic inequality, and social injustices.
Voter suppression remains a pressing issue, undermining foundational democratic rights. Despite the legal framework claiming equality, Black Americans disproportionately encounter harsher convictions and sentences within the criminal justice system. Education has seen some improvement, with more Black individuals obtaining advanced degrees, yet they still earn less than their white counterparts across all educational levels.
This analysis aims to shed light on states that have made progress in addressing racial disparities and those that still have considerable work ahead.
Key Findings
- Black Americans earn approximately 73.8% of what White Americans earn nationally.
- Homeownership rates for Black Americans are roughly half that of White Americans.
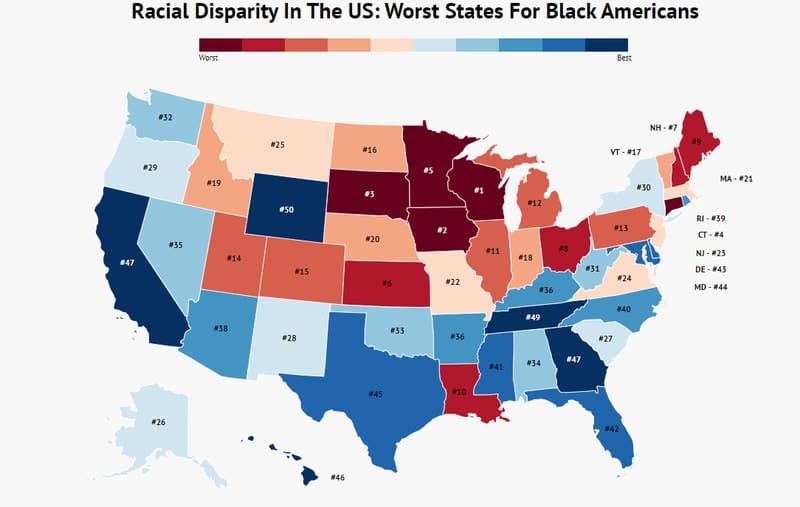
- Wisconsin exhibits the largest racial disparity between Black and White residents in the country.
- Following Wisconsin are Iowa and South Dakota.
- Most states with the most significant racial disparities are located in the Midwest, while many Southern states show comparatively better outcomes.
- Maine has the largest income gap between Black and White workers.
- The widest education achievement gap is found in Connecticut, with a 19.7% difference.
States with Significant Racial Disparities
The Midwest accounts for five of the top ten states on this list. From lower incomes to unfavorable educational outcomes, these states highlight the ongoing challenges faced by Black Americans. Continue reading to understand how we identified these states or scroll to the bottom to see where your state stands.
Methodology for Ranking States
We evaluated each state across four critical metrics:
- Income Gap (higher values indicate worse outcomes)
- Education Gap (higher values indicate worse outcomes)
- Homeownership Disparity (higher values indicate worse outcomes)
- Incarceration Rate for Black Americans per 100,000 (higher values indicate worse outcomes)
To assess the income gap, we utilized data from the American Community Survey. Instead of merely analyzing median incomes, we focused on the percentage difference between median incomes for Black and White Americans. A greater disparity signifies a larger wage gap and indicates further work needed for equality.
Education data also came from the ACS, where we calculated the difference in Bachelor’s Degree attainment between Black and White Americans. Given that higher education correlates with better lifetime earnings and lower unemployment risk, this is a vital metric to consider.
Homeownership is a crucial factor in building generational wealth. Thus, we compared the homeownership rates of Black and White Americans in each state using ACS data to determine the disparity in homeownership.
Data on incarceration rates was sourced from the Sentencing Project, which provided the number of Black Americans incarcerated per 100,000 individuals.
Below is a detailed breakdown of the ten states that ranked the worst based on our analysis, or you can jump to the full list of states at the end.
1. Wisconsin

Incarceration: 2542 per 100,000
Homeownership Inequality: 48%
Income Gap: 37%
Education Gap: 16.7%
Wisconsin ranks as the worst state for Black Americans based on these metrics. In the Badger State, the rate of Black imprisonment surpasses that of White imprisonment by more than tenfold. Coupled with low homeownership rates and a significant income gap, it is clear that Wisconsin faces substantial challenges ahead.
2. Iowa

Incarceration: 2349 per 100,000
Homeownership Inequality: 50%
Income Gap: 35%
Education Gap: 11.9%
Iowa follows closely behind Wisconsin, with Black Iowans being significantly less likely to own homes compared to their White counterparts. Additionally, they experience lower incomes, indicating a need for systemic improvements.
3. South Dakota

Incarceration: 1493 per 100,000
Homeownership Inequality: 35%
Income Gap: 32%
Education Gap: 18.8%
South Dakota ranks third among the states assessed. Although it shows better rates of homeownership and a smaller wage gap, it falls short in educational attainment, with Black residents 18% less likely to acquire a bachelor’s degree compared to their White counterparts.
4. Connecticut

Incarceration: 1392 per 100,000
Homeownership Inequality: 35%
Income Gap: 33%
Education Gap: 19.7%
Connecticut, despite being geographically distant from the previous states, shares similar challenges with significant wage disparities, low homeownership rates, and a concerning educational attainment gap.
5. Minnesota

Incarceration: 1219 per 100,000
Homeownership Inequality: 52%
Income Gap: 36%
Education Gap: 15.5%
While Minnesota has lower incarceration rates than many states, it still experiences significant disparities in homeownership and income, with Black Minnesotans facing severe challenges in wealth accumulation.
6. Kansas

Incarceration: 1734 per 100,000
Homeownership Inequality: 34%
Income Gap: 30%
Education Gap: 16.1%
Kansas ranks sixth, with high incarceration rates and a significant education gap, indicating that there is substantial room for improvement in addressing racial disparities in the state.
7. New Hampshire

Incarceration: 1040 per 100,000
Homeownership Inequality: 46%
Income Gap: 39%
Education Gap: 14.6%
New Hampshire has one of the highest income gaps in the nation, with Black residents earning 39% less than their White counterparts, equating to a staggering annual difference of $15,564, which could represent a significant down payment on a modest home.
8. Ohio
Incarceration: 1625 per 100,000
Homeownership Inequality: 37%
Income Gap: 28%
Education Gap: 12.2%
Ohio ranks eighth, characterized by generally poor performance across all metrics. While it may not have the worst statistics in any single category, it consistently underperforms in each area analyzed.
9. Maine

Incarceration: 839 per 100,000
Homeownership Inequality: 49%
Income Gap: 47%
Education Gap: 14.2%
Maine stands as the ninth worst state for Black Americans, with the largest income gap in the nation, which undoubtedly impacts the low homeownership rate among Black residents. A substantial income gap makes homeownership challenging.
10. Louisiana

Incarceration: 1740 per 100,000
Homeownership Inequality: 29%
Income Gap: 40%
Education Gap: 12.9%
Louisiana completes our list of the ten worst states for Black Americans. While homeownership rates are comparatively better than in other states, they do not offset significant deficiencies in income and education. Black residents in Louisiana face one of the largest income gaps in the nation.
Final Thoughts on Racial Disparities in the United States
The ten states listed exhibit notable shortcomings in education, income, incarceration, and homeownership. Although we focused on four primary areas, numerous other factors contribute to overall quality of life. Each of these metrics highlights critical disparities in opportunities available to Black Americans. For example, in Maine, Black residents have a median income that is $15,655 lower than that of their White counterparts. In Connecticut, the college graduation rate for Black Americans is nearly 20% lower. These disparities matter greatly and underscore the need for continued advocacy and policy reform. For a comprehensive view of how other states rank, see the complete list below:
| 1 | Wisconsin | 2542 per 100,000 | 47.99% | 37.31% | 16 |
| 2 | Iowa | 2349 per 100,000 | 50.05% | 35.05% | 11 |
| 3 | South Dakota | 1493 per 100,000 | 35.07% | 31.74% | 18 |
| 4 | Connecticut | 1392 per 100,000 | 34.74% | 33.34% | 19 |
| 5 | Minnesota | 1219 per 100,000 | 52.31% | 36.26% | 15 |
| 6 | Kansas | 1734 per 100,000 | 33.70% | 30.30% | 16 |
| 7 | New Hampshire | 1040 per 100,000 | 45.63% | 38.85% | 14 |
| 8 | Ohio | 1625 per 100,000 | 37.16% | 27.95% | 12 |
| 9 | Maine | 839 per 100,000 | 49.37% | 46.78% | 14 |
| 10 | Louisiana | 1740 per 100,000 | 28.67% | 39.51% | 12 |
| 11 | Illinois | 1533 per 100,000 | 33.70% | 28.34% | 15 |
| 12 | Michigan | 1682 per 100,000 | 36.56% | 25.59% | 12 |
| 13 | Pennsylvania | 1810 per 100,000 | 31.07% | 26.77% | 13 |
| 14 | Utah | 1481 per 100,000 | 44.85% | 9.80% | 17 |
| 15 | Colorado | 1891 per 100,000 | 30.38% | 21.23% | 14 |
| 16 | North Dakota | 888 per 100,000 | 58.86% | 36.31% | 9 |
| 17 | Vermont | 2357 per 100,000 | 36.84% | 24.44% | -2.2 |
| 18 | Indiana | 1616 per 100,000 | 38.27% | 26.09% | 9 |
| 19 | Idaho | 2160 per 100,000 | 34.87% | 25.38% | 1 |
| 20 | Nebraska | 1680 per 100,000 | 38.89% | 17.71% | 11 |
| 21 | Massachusetts | 605 per 100,000 | 31.91% | 28.26% | 16 |
| 22 | Missouri | 1654 per 100,000 | 34.69% | 20.53% | 11 |
| 23 | New Jersey | 1140 per 100,000 | 30.59% | 27.00% | 16 |
| 24 | Virginia | 1386 per 100,000 | 23.95% | 27.01% | 18 |
| 25 | Montana | 1985 per 100,000 | 61.21% | 13.13% | -5.3 |
| 26 | Alaska | 1053 per 100,000 | 30.95% | 33.09% | 11 |
| 27 | South Carolina | 1030 per 100,000 | 25.22% | 28.62% | 17 |
| 28 | New Mexico | 1326 per 100,000 | 31.74% | 31.04% | 9 |
| 29 | Oregon | 2061 per 100,000 | 29.87% | 23.73% | 8 |
| 30 | New York | 896 per 100,000 | 32.35% | 20.98% | 17 |
| 31 | West Virginia | 1234 per 100,000 | 31.82% | 32.67% | 6 |
| 32 | Washington | 1272 per 100,000 | 32.65% | 23.89% | 10 |
| 33 | Oklahoma | 2625 per 100,000 | 29.09% | 20.19% | 7 |
| 34 | Alabama | 1417 per 100,000 | 25.80% | 27.15% | 10 |
| 35 | Nevada | 1592 per 100,000 | 34.56% | 16.03% | 9 |
| 36 | Arkansas | 1665 per 100,000 | 28.27% | 23.09% | 9 |
| 36 | Kentucky | 1411 per 100,000 | 37.23% | 19.43% | 8 |
| 38 | Arizona | 2126 per 100,000 | 32.78% | 8.91% | 5 |
| 39 | Rhode Island | 934 per 100,000 | 30.94% | 20.94% | 15 |
| 40 | North Carolina | 951 per 100,000 | 27.39% | 25.10% | 13 |
| 41 | Mississippi | 1052 per 100,000 | 24.22% | 31.06% | 10 |
| 42 | Florida | 1621 per 100,000 | 24.74% | 19.01% | 11 |
| 43 | Delaware | 1238 per 100,000 | 28.96% | 21.05% | 11 |
| 44 | Maryland | 862 per 100,000 | 24.12% | 21.61% | 14 |
| 45 | Texas | 1844 per 100,000 | 27.19% | 11.86% | 5 |
| 46 | Hawaii | 585 per 100,000 | 27.33% | 23.51% | 12 |
| 47 | California | 1767 per 100,000 | 24.42% | 10.10% | 8 |
| 47 | Georgia | 1066 per 100,000 | 26.55% | 19.90% | 10 |
| 49 | Tennessee | 1166 per 100,000 | 29.98% | 18.55% | 8 |
| 50 | Wyoming | 1307 per 100,000 | 18.96% | -3.83% | -1.0 |
Stay updated with the latest research and engaging stories by subscribing to our weekly newsletter. Reach out to Kathy Morris at kmorris@zippia.com.
Author
Kathy is the head of content at Zippia with a knack for engaging audiences. Prior to joining Zippia, Kathy worked at Gateway Blend growing audiences across diverse brands. She graduated from Troy University with a degree in Social Science Education.