Find a Job You Really Want In
As we move into 2026, the landscape for black-owned businesses continues to evolve, but disparities remain. With only about 7% of businesses in the United States being black-owned, it’s crucial to identify which states are lacking in support for these enterprises. This article examines the states that are the least supportive of black-owned businesses, highlighting the challenges faced by entrepreneurs in these regions.
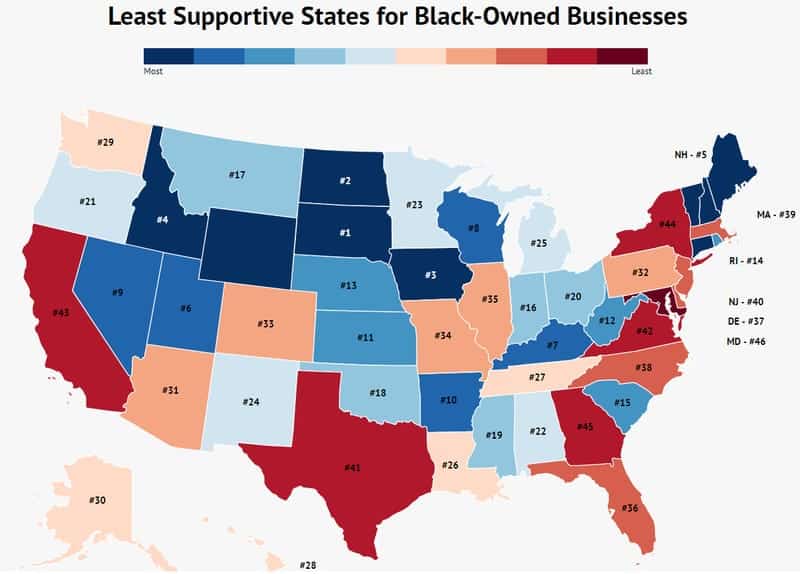
States Least Supportive of Black-Owned Businesses
These states exhibit low levels of support for black-owned businesses, reflected in their business counts and educational attainment among black residents. If your state is not listed, you may be fortunate to live in a more supportive environment. Check the table below to see how your state ranks in terms of support for black-owned businesses.
How We Determined The Least Supportive States For Black Businesses
To identify the least supportive states for black business owners, we analyzed four key factors:
- Number of black-owned businesses per capita
- Employment figures within black-owned businesses
- Percentage of black residents with a bachelor’s degree or higher
- Percentage of black workers employed in management and business roles
Our analysis began with the number of black-owned businesses per capita, utilizing data from the Census’ Annual Business Survey.
Next, we assessed the number of employees working within these businesses to understand their scale and success.
Recognizing that business growth is tied to education, we examined the percentage of black residents with a bachelor’s degree or higher using ACS data.
Finally, we looked at the proportion of black workers in management and business roles, also derived from ACS data.
Due to insufficient sample sizes in the Small Business Survey, Wyoming, Vermont, Connecticut, and Maine were excluded from our rankings.
1. South Dakota

Education: 6
Black-Owned Businesses: 33
Number of Employees: 166
South Dakota ranks as the least supportive state for black-owned businesses, with the lowest percentage of black residents holding a bachelor’s degree or higher in the U.S. Only 6% of black residents have achieved this educational milestone, and the state supports a mere 33 black-owned businesses.
2. North Dakota

Education: 15
Black-Owned Businesses: 97
Number of Employees: 317
North Dakota, with 97 black-owned businesses and only 317 employees, ranks as the second least supportive state. The percentage of black residents with a bachelor’s degree or higher stands at 14.8%.
3. Iowa

Education: 19
Black-Owned Businesses: 196
Number of Employees: 1,447
Iowa ranks third among states least supportive of black-owned businesses, with 196 black-owned businesses, reflecting a significant yet insufficient number compared to the national average.
4. Idaho

Education: 7
Black-Owned Businesses: 77
Number of Employees: 403
Idaho follows closely, with only 6.7% of black residents holding a bachelor’s degree and 77 black-owned businesses. However, its ranking is somewhat mitigated by the number of employees working in those businesses, totaling 403.
5. New Hampshire

Education: 18
Black-Owned Businesses: 86
Number of Employees: 1,363
New Hampshire ranks fifth, supporting only 86 black-owned businesses. However, it has a relatively higher percentage of black residents—18%—who have earned a bachelor’s degree.
6. Kentucky

Education: 19
Black-Owned Businesses: 751
Number of Employees: 9,272
Kentucky, with 751 black-owned businesses, ranks sixth in terms of support for these enterprises, with only 18.6% of black residents holding a bachelor’s degree or higher.
7. Utah

Education: 21
Black-Owned Businesses: 226
Number of Employees: 1,491
Utah holds the seventh position with 226 black-owned businesses, reflecting one of the lowest counts in the nation.
8. Wisconsin

Education: 17
Black-Owned Businesses: 1,044
Number of Employees: 15,329
Wisconsin, despite having the highest number of black-owned businesses on this list at 1,044, struggles with a low percentage of black residents holding a bachelor’s degree (16.7%).
9. Arkansas
Education: 18
Black-Owned Businesses: 700
Number of Employees: 5,029
Arkansas ranks ninth with 700 black-owned businesses and 17.8% of black residents having earned a bachelor’s degree.
10. Nevada

Education: 16
Black-Owned Businesses: 768
Number of Employees: 12,002
Nevada rounds out the list as the tenth least supportive state, with only 16% of its black residents having earned a bachelor’s degree, the fourth lowest nationwide.
Conclusion: The challenges for black-owned businesses persist, particularly in these ten states, which showcase low support systems and educational attainment. Recognizing these disparities is crucial for fostering a more equitable business environment across the nation. The comprehensive ranking of state support for black-owned businesses can be found in the table below.
| Rank | State | Education | Black-Owned Businesses | Number Of Employees |
|---|---|---|---|---|
| 1 | South Dakota | 6 | 33 | 166 |
| 2 | North Dakota | 14 | 97 | 317 |
| 3 | Iowa | 18 | 196 | 1,447 |
| 4 | Idaho | 6 | 77 | 403 |
| 5 | New Hampshire | 18 | 86 | 1,363 |
| 6 | Kentucky | 18 | 751 | 9,272 |
| 6 | Utah | 20 | 226 | 1,491 |
| 8 | Wisconsin | 16 | 1,044 | 15,329 |
| 9 | Arkansas | 17 | 700 | 5,029 |
| 9 | Nevada | 16 | 768 | 12,002 |
| 11 | Kansas | 20 | 445 | 8,768 |
| 12 | West Virginia | 21 | 160 | 1,866 |
| 13 | Nebraska | 21 | 247 | 2,060 |
| 14 | Rhode Island | 19 | 287 | 2,579 |
| 15 | South Carolina | 17 | 2,351 | 22,103 |
| 16 | Indiana | 20 | 1,361 | 23,067 |
| 17 | Montana | 58 | 19 | 94 |
| 18 | Oklahoma | 21 | 817 | 7,508 |
| 19 | Mississippi | 20 | 1,569 | 17,365 |
| 20 | Ohio | 18 | 3,068 | 43,186 |
| 21 | Alabama | 20 | 1,808 | 16,180 |
| 21 | Oregon | 25 | 588 | 4,070 |
| 23 | Minnesota | 22 | 1,057 | 23,041 |
| 24 | Michigan | 20 | 2,884 | 58,580 |
| 24 | New Mexico | 24 | 221 | 2,137 |
| 26 | Louisiana | 18 | 2,637 | 35,874 |
| 27 | Hawaii | 40 | 116 | 1,269 |
| 27 | Tennessee | 22 | 2,203 | 25,042 |
| 29 | Alaska | 34 | 156 | 1,615 |
| 29 | Washington | 25 | 1,487 | 11,846 |
| 31 | Arizona | 25 | 1,195 | 11,958 |
| 32 | Pennsylvania | 21 | 3,316 | 36,814 |
| 33 | Colorado | 31 | 1,198 | 8,005 |
| 34 | Missouri | 20 | 8,185 | 32,737 |
| 35 | Illinois | 24 | 4,258 | 48,642 |
| 36 | Florida | 23 | 11,932 | 72,280 |
| 36 | Delaware | 26 | 517 | 4,371 |
| 38 | North Carolina | 25 | 5,845 | 57,335 |
| 39 | Massachusetts | 30 | 1,893 | 26,509 |
| 40 | New Jersey | 28 | 4,028 | 30,043 |
| 41 | Texas | 27 | 9,728 | 124,735 |
| 42 | California | 28 | 10,287 | 81,530 |
| 42 | Virginia | 26 | 5,294 | 59,175 |
| 44 | New York | 27 | 11,395 | 72,486 |
| 45 | Georgia | 27 | 8,929 | 83,781 |
| 46 | Maryland | 33 | 6,570 | 64,023 |
Author
Amanda Postma is a writer for the Zippia Career Advice blog with a focus on creating entertaining content to help you through your job search. She received her BA from the University Of Missouri-Columbia.