Find a Job You Really Want In

As the holiday season approaches in 2026, many individuals are gearing up for a flurry of shopping and travel. This time of year brings a significant demand for seasonal workers, with countless job opportunities across various sectors. In fact, the latest data indicates a substantial number of seasonal job listings available nationwide.
“Where are all these seasonal jobs, and what positions are being filled?” you might wonder if you’re navigating the job market. We’ve compiled the answers for you:
A Summary of Seasonal Job Findings
- Retail continues to dominate seasonal employment, but there’s a surprising demand for driving jobs as well.
- States with lower unemployment rates typically offer more holiday job opportunities.
- Naples, FL leads the nation with the highest concentration of seasonal jobs (183 per 10,000 people).
- Notably, cities in Nevada and Hawaii have among the lowest availability of seasonal jobs.
Methodology Overview
To gather our findings, we analyzed a comprehensive pool of job listings available in 2026, focusing on positions labeled as “seasonal.” We sourced population data from the most recent census and excluded cities with populations below 10,000, ranking the cities and states based on jobs per 10,000 people.
The Correlation Between Unemployment Rates and Holiday Jobs
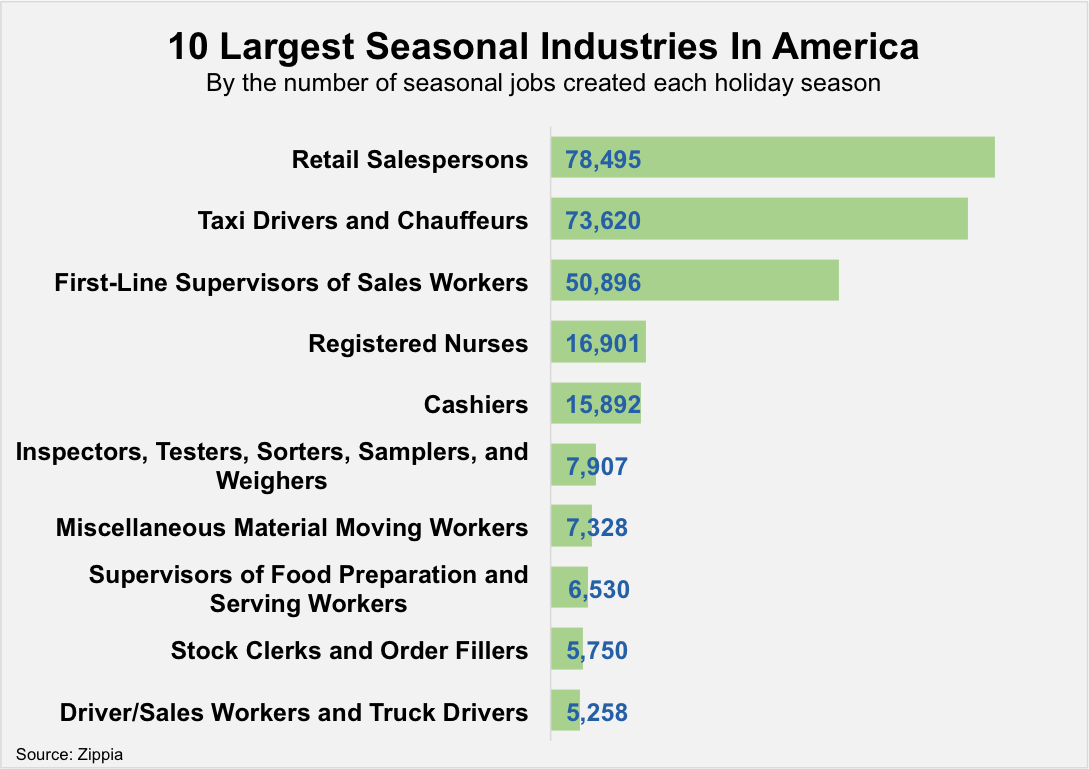
It’s no surprise that retail workers and their managers fill many of the top seasonal roles. However, the demand for taxi drivers and chauffeurs has also surged, likely driven by increased travel during the holiday season as people head to airports and events. Companies like Lyft continue to post numerous seasonal opportunities across various categories.
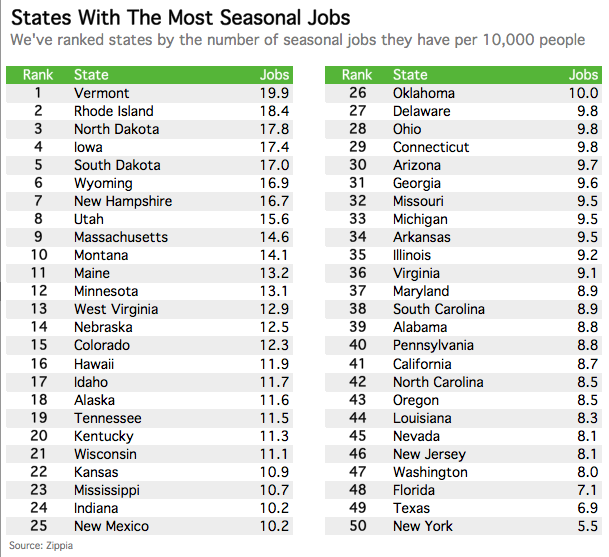
Vermont and Rhode Island stand out with the highest rates of seasonal employment, while many Midwestern states closely follow. Interestingly, a state’s unemployment rate often correlates with the availability of seasonal jobs, with some exceptions.

Since we rank based on jobs per capita, populous states can face a disadvantage, impacting their relative rankings.
City Job Market Trends
Notably, the seasonal job availability in cities does not always align with state job performance. Cities like Naples, known for its luxury malls, showcase a high number of holiday jobs, while cities in Nevada struggle to provide similar opportunities.
Top Locations for Seasonal Holiday Jobs Per Person
| Rank | State | Jobs Per 10,000 People |
|---|---|---|
| 1 | Vermont | 19 |
| 2 | Rhode Island | 18 |
| 3 | North Dakota | 17 |
| 4 | Iowa | 17 |
| 5 | South Dakota | 17 |
| 6 | Wyoming | 16 |
| 7 | New Hampshire | 16 |
| 8 | Utah | 15 |
| 9 | Massachusetts | 14 |
| 10 | Montana | 14 |
| 11 | Maine | 13 |
| 12 | Minnesota | 13 |
| 13 | West Virginia | 12 |
| 14 | Nebraska | 12 |
| 15 | Colorado | 12 |
| 16 | Hawaii | 11 |
| 17 | Idaho | 11 |
| 18 | Alaska | 11 |
| 19 | Tennessee | 11 |
| 20 | Kentucky | 11 |
| 21 | Wisconsin | 11 |
| 22 | Kansas | 10 |
| 23 | Mississippi | 10 |
| 24 | Indiana | 10 |
| 25 | New Mexico | 10 |
| 26 | Oklahoma | 10 |
| 27 | Delaware | 9 |
| 28 | Ohio | 9 |
| 29 | Connecticut | 9 |
| 30 | Arizona | 9 |
| 31 | Georgia | 9 |
| 32 | Missouri | 9 |
| 33 | Michigan | 9 |
| 34 | Arkansas | 9 |
| 35 | Illinois | 9 |
| 36 | Virginia | 9 |
| 37 | Maryland | 8 |
| 38 | South Carolina | 8 |
| 39 | Alabama | 8 |
| 40 | Pennsylvania | 8 |
| 41 | California | 8 |
| 42 | North Carolina | 8 |
| 43 | Oregon | 8 |
| 44 | Louisiana | 8 |
| 45 | Nevada | 8 |
| 46 | New Jersey | 8 |
| 47 | Washington | 8 |
| 48 | Florida | 7 |
| 49 | Texas | 6 |
| 50 | New York | 5 |
With the evolving job landscape, seasonal employment opportunities are more diverse than ever, driven by demand in various sectors. Whether you’re looking for a temporary position to make extra income or seeking to gain experience, the holiday season presents numerous options across the country. Stay informed about local job listings and take advantage of the bustling job market this holiday season!
Author
David Luther was the Content Marketing Editor for the Zippia Advice blog. He developed partnerships with external reporting agencies in addition to generating original research and reporting for the Zippia Career Advice blog. David obtained his BA from UNC Chapel Hill.