Find a Job You Really Want In
Even if you haven’t driven for Uber, you’ve likely ridden in one or a similar service. The gig economy has become a fundamental part of our society—and it continues to expand.
Uber positions itself as a flexible and lucrative way for individuals to earn money on their own terms. However, while flexibility is a clear advantage, the income aspect is often less straightforward.
Although driving for Uber might appear to be a great side hustle, many drivers find themselves facing challenges, including vehicle maintenance costs that can eat into their earnings.
So, is driving for Uber truly worth it? The answer largely depends on your location. We explored some of the most prominent Uber markets across the country to determine if drivers are genuinely profiting or if they would fare better elsewhere.
Below, we detail cities with the highest and lowest earnings for Uber drivers.
Where Uber Drivers Are Earning the Most
Where Uber Drivers Would Be Better Off Doing Almost Anything Else
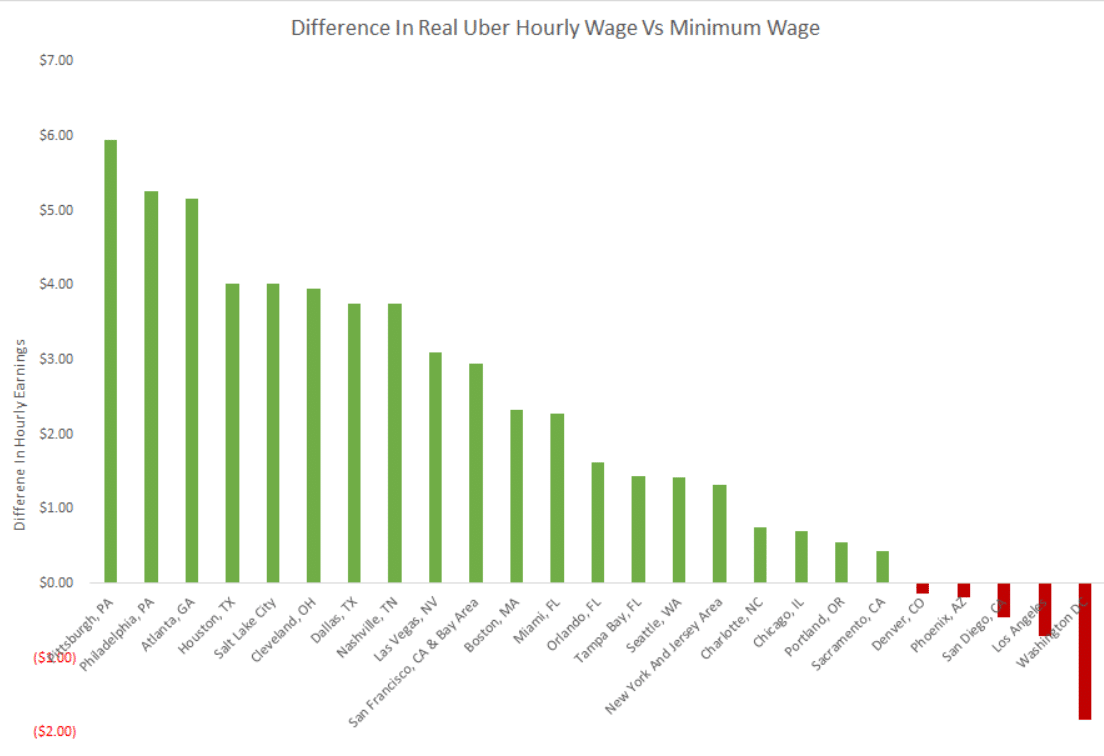
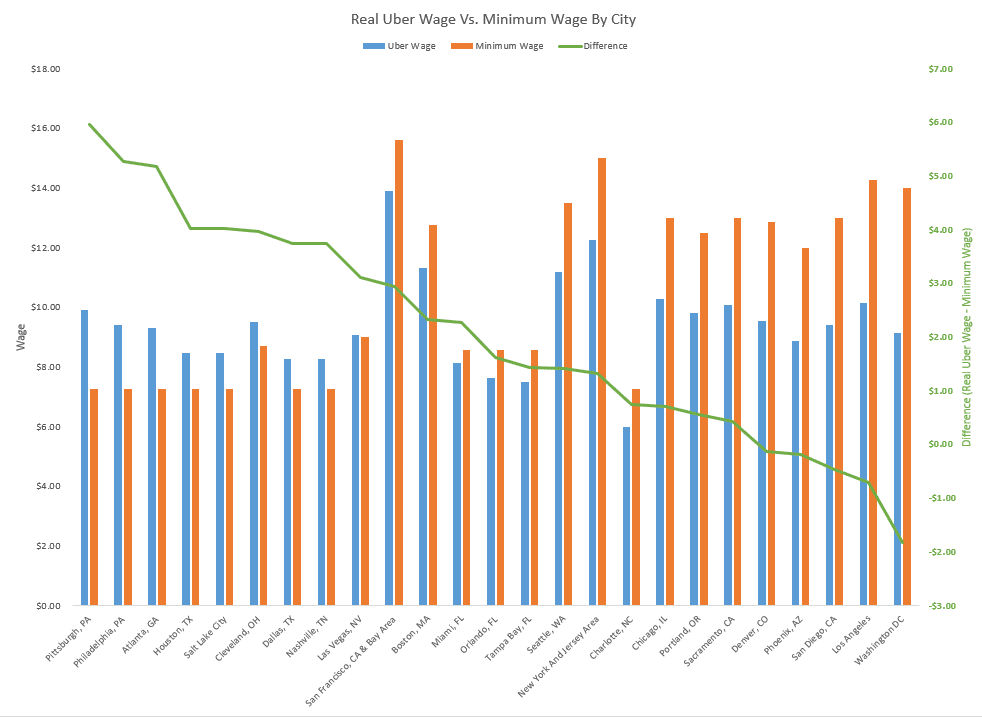
The cities where Uber drivers earn the most tend to be locations with lower living costs, while those with the least earnings are often expensive urban centers with higher minimum wages. We provide a complete analysis at the end, but first, let’s delve into our methodology.
How We Determined the Cities Where Uber Drivers Are Earning Decent Cash
We analyzed hourly Uber driver earnings in 25 of the busiest Uber markets using data from the RideShareGuy’s survey.
Initially, these earnings may seem promising. However, Uber drivers face various hidden expenses that can significantly reduce their profit.
Uber drivers typically incur the following costs:
- Fuel
- Vehicle depreciation
- Maintenance and repairs
- Self-employment taxes
According to the IRS, depreciation and gas costs are calculated at $0.58 per mile, meaning driving just 10 miles could cost a driver $5.80 in actual earnings. In most urban areas, a driver is unlikely to complete less than 10 miles in an hour. This amount doesn’t even factor in self-employment taxes.
To accurately reflect earnings, we subtracted a flat 20% from the reported hourly earnings of Uber drivers.
After establishing the hourly wage, we considered whether drivers would be better off in alternative employment. Given the diverse qualifications and backgrounds of Uber drivers, we aimed to avoid assumptions about their earning potential outside of Uber.
Thus, we compared the adjusted hourly Uber earnings by city to the local minimum wage. If the Uber earnings surpassed the minimum wage, driving for Uber was deemed a better option. Conversely, if the earnings fell below the minimum wage, drivers might be better off working at McDonald’s or other jobs.
It’s important to note that many states and cities raised their minimum wage around 2019 and into 2020. A review conducted at that time may yield different results.
The formula we used was:
- Average Hourly Uber Earnings – 20% = Actual Uber Earnings
- Actual Uber Earnings – Minimum Wage = Is driving for Uber worthwhile in this location?
A positive result indicates that driving for Uber provides better hourly earnings than a minimum wage job. A negative result signifies lower earnings than the minimum wage.
The Best Places to Drive for Uber
1. Pittsburgh, PA

Actual Hourly Uber Rate: $13.20
Minimum Wage: $7.25
Difference After Minimum Wage: $5.95
Pittsburgh Uber drivers, on average, retain nearly $6 above the minimum wage. For those driving 20 hours a week, that adds up to about $120 per week, $480 per month, and $5,760 annually. While health insurance may not be included, it’s a helpful boost to financial stability.
2. Philadelphia, PA

Actual Hourly Uber Rate: $12.52
Minimum Wage: $7.25
Difference After Minimum Wage: $5.27
In Philadelphia, drivers earn $5.27 more than the minimum wage. This city remains a strong market for Uber drivers.
3. Atlanta, GA

Actual Hourly Uber Rate: $12.42
Minimum Wage: $7.25
Difference After Minimum Wage: $5.17
Atlanta’s Uber drivers earn over $5 more than the federal minimum wage, making it a favorable market for driving.
4. Salt Lake City, UT
Actual Hourly Uber Rate: $11.27
Minimum Wage: $7.25
Difference After Minimum Wage: $4.02
Salt Lake City remains a great option, with Uber drivers earning over $4 above minimum wage.
5. Houston, TX
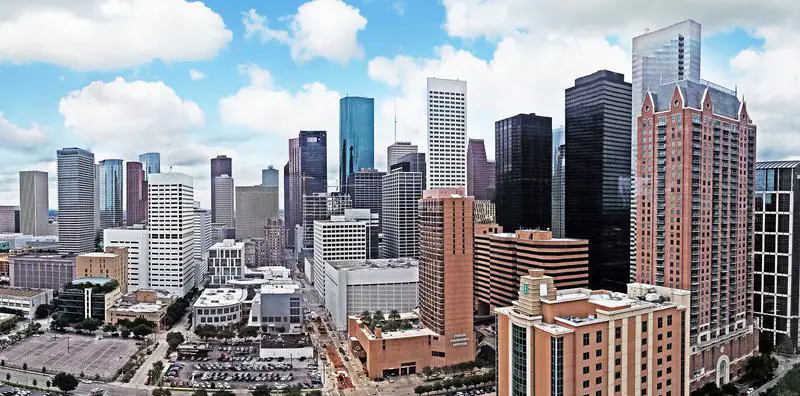
Actual Hourly Uber Rate: $11.27
Minimum Wage: $7.25
Difference After Minimum Wage: $4.02
Houston drivers also earn about $4 more than the federal minimum wage, making it a viable market for Uber driving.
The Worst Places to Drive for Uber
1. Washington, DC
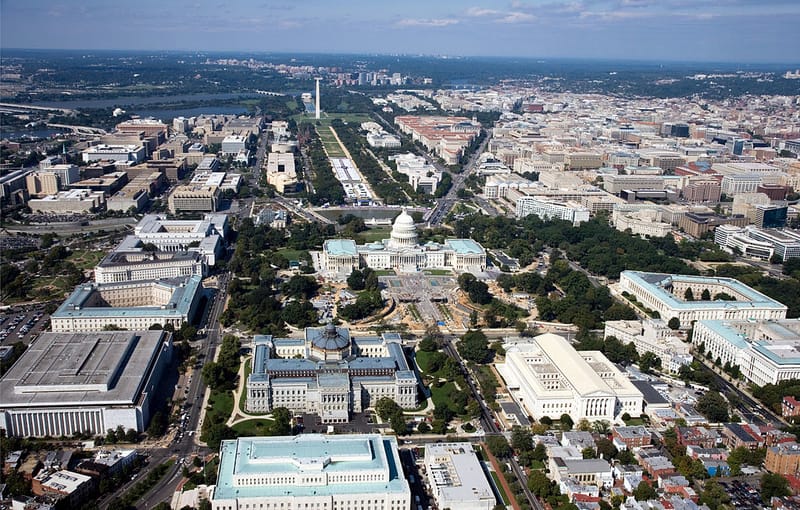
Actual Hourly Uber Rate: $12.17
Minimum Wage: $14
Difference After Minimum Wage: -$1.83
In Washington, DC, high living costs and a higher minimum wage make it challenging for Uber drivers, who earn nearly $2 less than the minimum wage.
2. Los Angeles, CA
Actual Hourly Uber Rate: $13.54
Minimum Wage: $14.25
Difference After Minimum Wage: -$0.71
In Los Angeles, drivers earn less than they would in a minimum wage position, highlighting the financial strain of living in this expensive city.
3. San Diego, CA
Actual Hourly Uber Rate: $12.54
Minimum Wage: $13
Difference After Minimum Wage: -$0.46
San Diego drivers find themselves similarly disadvantaged, with earnings falling short of the local minimum wage.
4. Phoenix, AZ
Actual Hourly Uber Rate: $11.81
Minimum Wage: $12
Difference After Minimum Wage: -$0.19
Phoenix drivers also earn less than the minimum wage due to recent increases that surpassed their earnings.
5. Denver, CO

Actual Hourly Uber Rate: $12.71
Minimum Wage: $12.85
Difference After Minimum Wage: -$0.14
In Denver, the difference is minimal, but still significant over time; driving for Uber may not be the best financial choice here.
Summary: Where Uber Drivers Earn the Most—and Where They Don’t
If you’re an Uber driver and making decent money in one of the markets listed as unfavorable, congratulations! These figures are averages, and individual experiences can vary significantly based on driving times and vehicle types.
The flexibility of ridesharing may also hold personal economic value that could alter your decision-making.
However, we advise all Uber drivers to meticulously track their expenses—not just for tax purposes but to truly assess whether driving for Uber is financially viable.
Jobs in the gig economy can often be misleading. While it might feel good to bring in a higher weekly income, tax time can reveal the reality of your financial situation. Unforeseen expenses, such as vehicle repairs, can also quickly diminish your earnings.
Moreover, we did not account for the potential opportunity costs associated with “driving for yourself.” It’s important to remember that Uber drivers don’t receive healthcare or other employment benefits, and if they’re deactivated from the platform, they won’t qualify for unemployment.
Ultimately, many Uber drivers are making a choice heavily influenced by their location! Explore the complete earnings breakdown below.
Where Uber Drivers Make the Most—and the Least—Money
| Rank | Market | Actual Hourly Uber Wage | Hourly Costs | Minimum Wage | Difference |
|---|---|---|---|---|---|
| 1 | Pittsburgh, PA | $13.20 | $3.30 | $7.25 | $5.95 |
| 2 | Philadelphia, PA | $12.52 | $3.13 | $7.25 | $5.27 |
| 3 | Atlanta, GA | $12.42 | $3.10 | $7.25 | $5.17 |
| 4 | Houston, TX | $11.27 | $2.82 | $7.25 | $4.02 |
| 5 | Salt Lake City, UT | $11.27 | $2.82 | $7.25 | $4.02 |
| 6 | Cleveland, OH | $12.66 | $3.17 | $8.70 | $3.96 |
| 7 | Dallas, TX | $11.00 | $2.75 | $7.25 | $3.75 |
| 8 | Nashville, TN | $11.00 | $2.75 | $7.25 | $3.75 |
| 9 | Las Vegas, NV | $12.10 | $3.02 | $9.00 | $3.10 |
| 10 | San Francisco, CA & Bay Area | $18.54 | $4.63 | $15.59 | $2.95 |
| 11 | Boston, MA | $15.08 | $3.77 | $12.75 | $2.33 |
| 12 | Miami, FL | $10.84 | $2.71 | $8.56 | $2.28 |
| 13 | Orlando, FL | $10.18 | $2.55 | $8.56 | $1.62 |
| 14 | Tampa Bay, FL | $10.00 | $2.50 | $8.56 | $1.44 |
| 15 | Seattle, WA | $14.92 | $3.73 | $13.50 | $1.42 |
| 16 | New York And Jersey Area | $16.32 | $4.08 | $15.00 | $1.32 |
| 17 | Charlotte, NC | $8.00 | $2.00 | $7.25 | $0.75 |
| 18 | Chicago, IL | $13.71 | $3.43 | $13.00 | $0.71 |
| 19 | Portland, OR | $13.06 | $3.26 | $12.50 | $0.56 |
| 20 | Sacramento, CA | $13.43 | $3.36 | $13.00 | $0.43 |
| 21 | Denver, CO | $12.71 | $3.18 | $12.85 | -$0.14 |
| 22 | Phoenix, AZ | $11.81 | $2.95 | $12.00 | -$0.19 |
| 23 | San Diego, CA | $12.54 | $3.14 | $13.00 | -$0.46 |
| 24 | Los Angeles, CA | $13.54 | $3.39 | $14.25 | -$0.71 |
| 25 | Washington, DC | $12.17 | $3.04 | $14.00 | -$1.83 |
Want the latest research and most engaging stories first? Email Kathy Morris at kmorris@zippia.com to be added to our weekly newsletter.
Author
Kathy is the head of content at Zippia with a knack for engaging audiences. Prior to joining Zippia, Kathy worked at Gateway Blend growing audiences across diverse brands. She graduated from Troy University with a degree in Social Science Education.


