Find a Job You Really Want In
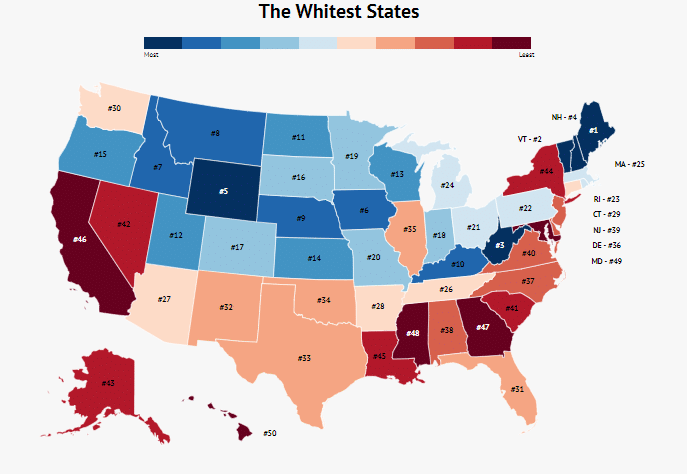
The Whitest States in America: A 2026 Perspective
America, often celebrated as the great melting pot, showcases a wide array of cultures and ethnicities from around the world. However, certain regions of the United States continue to exhibit significantly less diversity than others.
In this updated analysis, we delve into the latest American Community Survey (ACS) Census data to identify the whitest states in the U.S. The findings may align with your expectations.
Top 10 Whitest States
All of the states listed above have populations that are over 86% white, with the top seven states exceeding 90% white.
Top 10 Least White States
For a comprehensive understanding, scroll to the end to view the full ranking of all 50 states.
Methodology
To identify the whitest states, we referenced the latest ACS Census data. We calculated the percentage of the population that identified as “One race, white.” Higher percentages indicate a higher proportion of white residents.
Understanding America’s Cultural Landscape
America’s cultural and racial composition varies significantly by region. As observed, some states possess remarkably less diversity than others. However, many states feature urban centers that are far more diverse than their rural counterparts. The best way to appreciate the cultural richness of a city is through firsthand experience.
Explore the full ranking of all 50 states below:
The Whitest States
| Rank | State | Percent White |
|---|---|---|
| 1 | Maine | 94.3% |
| 2 | Vermont | 94.2% |
| 3 | West Virginia | 93.1% |
| 4 | New Hampshire | 92.9% |
| 5 | Wyoming | 91.4% |
| 6 | Iowa | 90.0% |
| 7 | Idaho | 90.0% |
| 8 | Montana | 88.5% |
| 9 | Nebraska | 87.1% |
| 10 | Kentucky | 87.0% |
| 11 | North Dakota | 86.6% |
| 12 | Utah | 86.4% |
| 13 | Wisconsin | 85.4% |
| 14 | Kansas | 84.4% |
| 15 | Oregon | 84.3% |
| 16 | South Dakota | 84.3% |
| 17 | Colorado | 84.0% |
| 18 | Indiana | 83.3% |
| 19 | Minnesota | 82.8% |
| 20 | Missouri | 82.2% |
| 21 | Ohio | 81.3% |
| 22 | Pennsylvania | 80.5% |
| 23 | Rhode Island | 80.5% |
| 24 | Michigan | 78.4% |
| 25 | Massachusetts | 78.1% |
| 26 | Tennessee | 77.6% |
| 27 | Arizona | 77.2% |
| 28 | Arkansas | 76.7% |
| 29 | Connecticut | 75.9% |
| 30 | Washington | 75.4% |
| 31 | Florida | 75.1% |
| 32 | New Mexico | 74.8% |
| 33 | Texas | 74.0% |
| 34 | Oklahoma | 72.3% |
| 35 | Illinois | 71.5% |
| 36 | Delaware | 68.8% |
| 37 | North Carolina | 68.7% |
| 38 | Alabama | 68.1% |
| 39 | New Jersey | 67.8% |
| 40 | Virginia | 67.6% |
| 41 | South Carolina | 67.2% |
| 42 | Nevada | 65.6% |
| 43 | Alaska | 64.6% |
| 44 | New York | 63.7% |
| 45 | Louisiana | 62.0% |
| 46 | California | 59.7% |
| 47 | Georgia | 58.6% |
| 48 | Mississippi | 58.4% |
| 49 | Maryland | 55.5% |
| 50 | Hawaii | 25.0% |
Author
Kathy is the head of content at Zippia with a knack for engaging audiences. Prior to joining Zippia, Kathy worked at Gateway Blend growing audiences across diverse brands. She graduated from Troy University with a degree in Social Science Education.