Find a Job You Really Want In
The States With The Most Despair in 2026
The landscape of mental health and economic stability has evolved over the past few years, with various factors contributing to despair across different states. In 2026, it remains evident that some states are experiencing higher levels of despair than others. This article explores the current state of despair in the U.S., focusing on factors such as depression rates, opioid prescriptions, poverty, and overall work-life balance.
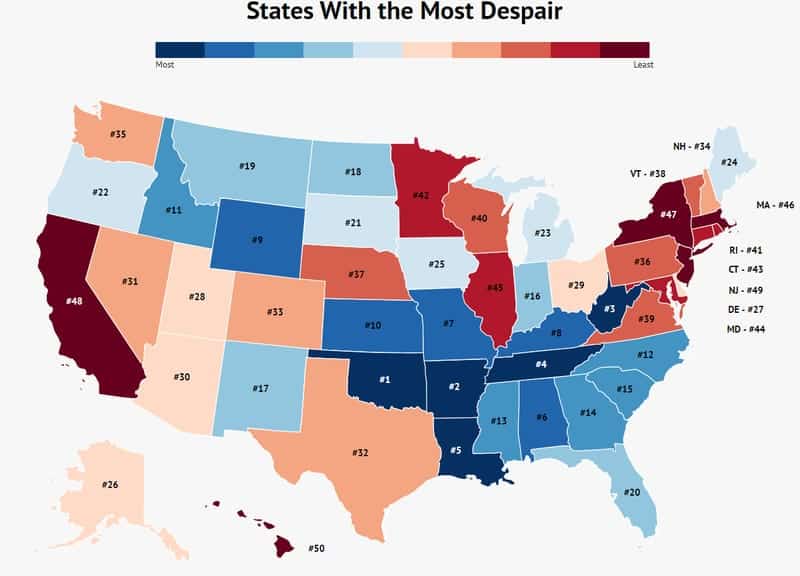
These 10 states are currently facing the highest levels of despair:
States With the Most Despair
Research indicates that pain, whether physical, emotional, or economic, is a significant contributor to despair. States grappling with high opioid prescriptions, obesity rates, and poverty levels are particularly affected. This analysis ranks states based on their depression rates, suicide rates, opioid prescriptions, poverty rates, and average hours worked.
Keep reading to discover the extent of despair in each state.
How We Determined The States In The Most Despair
Each state was ranked 1-to-50 based on five critical factors:
- Depression rate
- Suicides per 100,000 people
- Opioid prescriptions per 100 people
- Poverty rate
- Average hours worked
To assess despair levels, we focused on factors that contribute to and are indicative of despair. Our data sources include BlueCross’s Executive Summary on national depression, CDC statistics for suicide and opioid prescriptions, and the U.S. Census American Community Survey for poverty rates and hours worked.
1. Oklahoma
Depression Rate: 5%
Opioid Prescriptions: 79.1
Suicides By State: 20
Oklahoma ranks highest in despair, with a significant average workweek of 39.8 hours and a troubling opioid prescription rate.
2. Arkansas
Depression Rate: 4.7%
Opioid Prescriptions: 93.5
Suicides By State: 18.3
Arkansas is second in despair, with the highest prescription rate in the country, indicating chronic pain issues among residents.
3. West Virginia

Depression Rate: 4.4%
Opioid Prescriptions: 69.3
Suicides By State: 21.2
West Virginia faces significant challenges, with high suicide rates and high poverty rates contributing to its rank.
4. Tennessee

Depression Rate: 4.8%
Opioid Prescriptions: 81.8
Suicides By State: 16.6
Tennessee ranks fourth, with its high opioid prescription rate suggesting widespread pain management issues.
5. Louisiana

Depression Rate: 4.7%
Opioid Prescriptions: 79.4
Suicides By State: 15.1
Despite lower rates in some areas, Louisiana’s high poverty levels significantly contribute to its despair ranking.
6. Alabama

Depression Rate: 4.8%
Opioid Prescriptions: 97.5
Suicides By State: 16.5
Alabama leads the nation in opioid prescriptions, indicating a significant public health issue contributing to despair.
7. Missouri

Depression Rate: 5.1%
Opioid Prescriptions: 63.4
Suicides By State: 19.5
Missouri continues to struggle with high depression rates, reflecting the mental health crisis faced by many residents.
8. Kentucky

Depression Rate: 4.6%
Opioid Prescriptions: 79.5
Suicides By State: 17.5
Kentucky’s opioid prescription rates continue to be concerning, contributing to its overall despair ranking.
9. Wyoming

Depression Rate: 4.7%
Opioid Prescriptions: 57.1
Suicides By State: 25
Wyoming experiences the highest suicide rate in the country, highlighting a critical mental health crisis.
10. Kansas

Depression Rate: 4.9%
Opioid Prescriptions: 64.3
Suicides By State: 19
Kansas rounds out the top ten, showing significant challenges with mental health and substance use issues.
Summary of the States with the Most Despair
As we navigate a complex world, the importance of supporting one another cannot be overstated. Communities in these states are facing unique challenges, with some turning to substances for relief while others may be grappling with severe mental health issues. It’s crucial to reach out and connect with those who may need support, fostering a sense of community and resilience.
| Rank | State | Poverty Rates | Suicide Numbers | Depression Rates |
|---|---|---|---|---|
| 1 | Oklahoma | 9% | 22 | 6 |
| 2 | Arkansas | 13% | 24 | 4 |
| 3 | West Virginia | 11% | 14 | 4 |
| 4 | Tennessee | 11% | 13 | 4 |
| 5 | Louisiana | 9% | 11 | 2 |
| 6 | Alabama | 13% | 19 | 4 |
| 7 | Missouri | 10% | 13 | 5 |
| 8 | Kentucky | 11% | 15 | 4 |
| 9 | Wyoming | 11% | 25 | 4 |
| 10 | Kansas | 10% | 8 | 3 |
| 11 | Idaho | 12% | 23 | 5 |
| 12 | North Carolina | 8% | 19 | 5 |
| 13 | Mississippi | 12% | 19 | 4 |
| 14 | Georgia | 13% | 19 | 5 |
| 15 | South Carolina | 11% | 18 | 5 |
| 16 | Indiana | 10% | 21 | 4 |
| 17 | New Mexico | 10% | 15 | 4 |
| 18 | North Dakota | 11% | 19 | 5 |
| 19 | Montana | 12% | 18 | 6 |
| 20 | Florida | 11% | 14 | 4 |
| 21 | South Dakota | 13% | 16 | 4 |
| 22 | Oregon | 14% | 15 | 4 |
| 23 | Michigan | 17% | 17 | 4 |
| 24 | Maine | 13% | 10 | 3 |
| 25 | Iowa | 12% | 14 | 4 |
| 26 | Alaska | 11% | 24 | 3 |
| 27 | Delaware | 13% | 19 | 5 |
| 28 | Utah | 9% | 10 | 4 |
| 29 | Ohio | 14% | 19 | 3 |
| 30 | Arizona | 17% | 18 | 4 |
| 31 | Nevada | 14% | 8 | 4 |
| 32 | Texas | 14% | 15 | 4 |
| 33 | Colorado | 12% | 11 | 4 |
| 34 | New Hampshire | 13% | 20 | 3 |
| 35 | Washington | 20% | 25 | 4 |
| 36 | Pennsylvania | 15% | 13 | 3 |
| 37 | Nebraska | 16% | 20 | 5 |
| 38 | Vermont | 15% | 15 | 3 |
| 39 | Virginia | 10% | 10 | 5 |
| 40 | Wisconsin | 14% | 13 | 4 |
| 41 | Rhode Island | 10% | 9 | 5 |
| 42 | Minnesota | 13% | 11 | 5 |
| 43 | Connecticut | 18% | 21 | 4 |
| 44 | Maryland | 14% | 15 | 4 |
| 45 | Illinois | 14% | 14 | 4 |
| 46 | Massachusetts | 13% | 9 | 6 |
| 47 | New York | 17% | 16 | 4 |
| 48 | California | 15% | 16 | 4 |
| 49 | New Jersey | 20% | 13 | 3 |
| 50 | Hawaii | 19% | 15 | 4 |
Author
Amanda Postma is a writer for the Zippia Career Advice blog with a focus on creating entertaining content to help you through your job search. She received her BA from the University Of Missouri-Columbia.