Find a Job You Really Want In
As mail-in voting continues to evolve in the United States, some states are facing significant challenges in facilitating this electoral option. The influence of recent legislative changes and shifts in public policy have made access to mail-in voting more difficult in certain regions.
Postal workers are experiencing increased pressure as they manage a higher volume of mail, and the U.S. Postal Service (USPS) is grappling with the logistics of delivering mail-in ballots. The reduction in approved overtime and operational adjustments, including the removal of mail sorting machines, have compounded these challenges. Additionally, the USPS has notably decreased the number of mail collection boxes across the country over the past year, raising concerns about accessibility for voters.
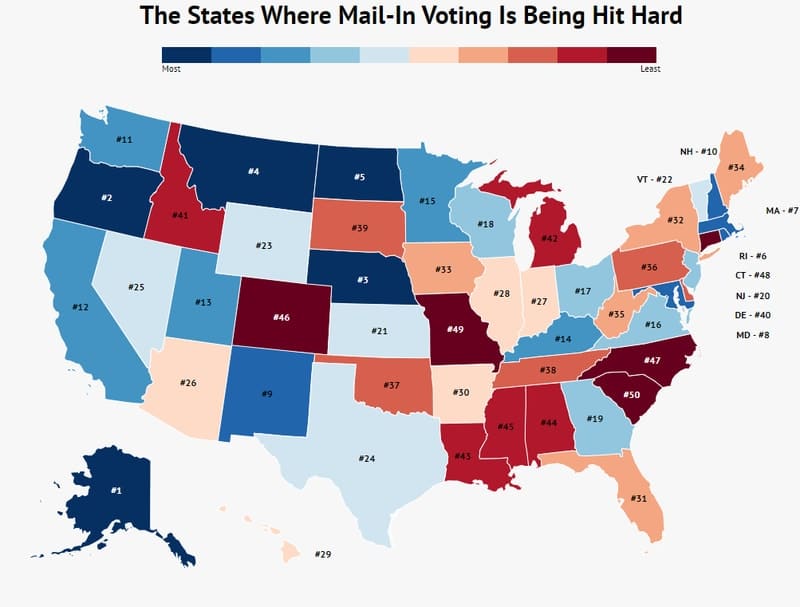
In light of these issues, we examined which states are experiencing the most significant reductions in mail collection boxes, ultimately affecting voters’ ability to cast their ballots via mail. Here are the ten states most impacted:
The 10 Most Affected States
- Alaska
- Oregon
- Nebraska
- Montana
- North Dakota
- Rhode Island
- Massachusetts
- Maryland
- New Mexico
- New Hampshire
If your state is among those listed, you might encounter difficulties when mailing in your vote. The reduction in collection boxes could mean longer distances to reach a drop-off location, which may disproportionately affect individuals without access to a vehicle or public transportation, ultimately influencing voter turnout.
How We Determined This
To identify the states hardest hit by reductions in mail-in voting, we evaluated each state based on three key metrics:
- Overall Mail Drop Boxes Lost (2019-2020)
- Mail Drop Boxes Per 10,000 People
- Percentage Decrease of Drop Boxes Year Over Year
By focusing on the loss of mail drop boxes, we can gain insight into the accessibility challenges voters may face. While there are other factors affecting mail-in voting (such as sorting machine availability and mail delays), the count of visible collection boxes provides a clearer indication of current operational trends.
The data was sourced from MailboxLocate, which compiled updated statistics from the United States Postal Service.
1. Alaska

Percent Decrease: 6.8%
Lost Boxes: -29
Boxes Per 10K: 73
Alaska faces the most significant challenges with mail-in voting, having lost 29 collection boxes since 2019—a 6.8% decrease, the highest in the nation. This leaves only 73 boxes for every 10,000 residents, one of the lowest ratios in the country.
2. Oregon

Percent Decrease: 6.6%
Lost Boxes: -173
Boxes Per 10K: 422
Oregon has seen a decrease of 173 collection boxes, translating to a 6.6% decline in accessible mail-in voting options. With a population density taken into account, this results in 422 boxes per 10,000 people.
3. Nebraska
Percent Decrease: 3.2%
Lost Boxes: -68
Boxes Per 10K: 193
Nebraska has experienced a loss of 68 collection boxes, resulting in a 3.2% decrease since 2019. Currently, there are 193 boxes available for every 10,000 residents, indicating potential difficulties for voters.
4. Montana

Percent Decrease: 3.0%
Lost Boxes: -43
Boxes Per 10K: 107
Montana ranks fourth, with a 3% decrease in collection boxes, now totaling only 107 for every 10,000 people.
5. North Dakota

Percent Decrease: 2.9%
Lost Boxes: -27
Boxes Per 10K: 76
North Dakota has lost 27 collection boxes, marking a 2.9% decrease, which results in only 76 boxes available per 10,000 residents.
6. Rhode Island

Percent Decrease: 2.4%
Lost Boxes: -24
Boxes Per 10K: 106
Rhode Island has seen a 2.4% decrease in collection boxes, losing 24, leaving only 106 boxes per 10,000 people.
7. Massachusetts

Percent Decrease: 2.1%
Lost Boxes: -166
Boxes Per 10K: 689
Despite losing 166 collection boxes, Massachusetts still maintains a relatively high number with 689 available per 10,000 residents, resulting in a 2.1% decrease overall.
8. Maryland

Percent Decrease: 2.0%
Lost Boxes: -100
Boxes Per 10K: 605
Maryland comes in with a 2% decrease, having lost 100 collection boxes, which still leaves residents with 605 options per 10,000 people.
9. New Mexico

Percent Decrease: 1.8%
Lost Boxes: -27
Boxes Per 10K: 210
New Mexico ranks ninth with a 1.8% decrease, leaving only 210 collection boxes for every 10,000 people.
10. New Hampshire

Percent Decrease: 1.6%
Lost Boxes: -26
Boxes Per 10K: 136
New Hampshire rounds out the list with a 1.6% decrease, losing 26 boxes, resulting in a total of only 136 boxes per 10,000 residents.
Summary of the States Where Mail-In Voting is Being Hit Hard
The USPS continues to face challenges in maintaining timely mail delivery within its budgetary constraints. These issues are particularly critical as they threaten to impact electoral participation across the nation.
The reduction in collection boxes severely limits access to mail-in voting, which may ultimately affect the outcome of elections. These ten states exemplify where voters may struggle to meet mail-in voting deadlines. A comprehensive table below provides an overview of how all states compare in this regard.
| Rank | State | Decrease Percentage | Lost Boxes | Boxes Per 10K |
|---|---|---|---|---|
| 1 | Alaska | 6.84% | -29 | 73 |
| 2 | Oregon | 6.61% | -173 | 422 |
| 3 | Nebraska | 3.19% | -68 | 193 |
| 4 | Montana | 2.97% | -43 | 107 |
| 5 | North Dakota | 2.90% | -27 | 76 |
| 6 | Rhode Island | 2.42% | -24 | 106 |
| 7 | Massachusetts | 2.12% | -166 | 689 |
| 8 | Maryland | 1.96% | -100 | 605 |
| 9 | New Mexico | 1.82% | -27 | 210 |
| 10 | New Hampshire | 1.64% | -26 | 136 |
| 11 | Washington | 2.73% | -99 | 761 |
| 12 | California | 2.90% | -470 | 3,951 |
| 13 | Utah | 2.13% | -24 | 321 |
| 14 | Kentucky | 1.61% | -54 | 447 |
| 15 | Minnesota | 1.58% | -71 | 564 |
| 16 | Virginia | 1.93% | -96 | 854 |
| 17 | Ohio | 1.64% | -146 | 1,169 |
| 18 | Wisconsin | 1.32% | -57 | 582 |
| 19 | Georgia | 1.81% | -68 | 1,062 |
| 20 | New Jersey | 1.42% | -90 | 888 |
| 21 | Kansas | 0.89% | -22 | 291 |
| 22 | Vermont | 0.55% | -6 | 62 |
| 23 | Wyoming | 0.76% | -4 | 58 |
| 24 | Texas | 1.20% | -118 | 2,900 |
| 25 | Nevada | 1.18% | -12 | 308 |
| 26 | Arizona | 1.43% | -37 | 728 |
| 27 | Indiana | 1.05% | -47 | 673 |
| 28 | Illinois | 0.92% | -100 | 1,267 |
| 29 | Hawaii | 0.98% | -6 | 142 |
| 30 | Arkansas | 0.50% | -14 | 302 |
| 31 | Florida | 1.20% | -73 | 2,148 |
| 32 | New York | 0.55% | -100 | 1,945 |
| 33 | Iowa | 0.41% | -15 | 316 |
| 34 | Maine | 0.39% | -8 | 134 |
| 35 | West Virginia | 0.34% | -9 | 179 |
| 36 | Pennsylvania | 0.40% | -54 | 1,280 |
| 37 | Oklahoma | 0.35% | -9 | 396 |
| 38 | Tennessee | 0.44% | -12 | 683 |
| 39 | South Dakota | 0.00% | 0 | 88 |
| 40 | Delaware | 0.00% | 0 | 97 |
| 41 | Idaho | 0.27% | -3 | 179 |
| 42 | Michigan | 0.37% | -24 | 999 |
| 43 | Louisiana | 0.35% | -8 | 465 |
| 44 | Alabama | 0.34% | -10 | 490 |
| 45 | Mississippi | 0.28% | -5 | 298 |
| 46 | Colorado | 0.34% | -11 | 576 |
| 47 | North Carolina | 0.33% | -16 | 1,049 |
| 48 | Connecticut | 0.11% | -3 | 357 |
| 49 | Missouri | 0.18% | -9 | 614 |
| 50 | South Carolina | -0.17% | 4 | 515 |
Author
Amanda Postma is a writer for the Zippia Career Advice blog with a focus on creating entertaining content to help you through your job search. She received her BA from the University Of Missouri-Columbia.