- Commute Statistics
15+ Average Commute Time Statistics [2026]: Understanding the Average American Commute
Research Summary. Whether you live in an urban center or a suburban area, nearly all Americans face some form of daily commute. With cars remaining the primary mode of transportation, it’s common to find yourself navigating through traffic on your way to work.
But what does the average American commute look like in 2026? Our comprehensive research reveals the following key statistics about commuting in the U.S. today:
-
The average one-way commute for Americans is 27.6 minutes.
-
New York City, NY, continues to have the longest average commute time in the U.S. at 34.7 minutes.
-
Since 1980, the average American commute time has increased by 27% (from 21.7 minutes to 27.6 minutes).
-
The average American commutes 41 miles a day to and from work.
-
76.4% of U.S. workers drive alone to work.
For further insights, we have organized the data in various categories:
State | City | Means of Transportation | Other

General Average Commute Time Statistics
With an average of 41 miles traveled daily for work, it’s evident that car travel dominates. However, commuting experiences vary widely among Americans. Our findings indicate:
-
74% of Americans commute to work every day.
While the rise of remote work has influenced commuting patterns, about 26% of Americans still work remotely, reducing their need to commute.
-
The average American’s total commute time is 55 minutes.
Considering that the average one-way trip takes 27.6 minutes, this means commuters spend nearly an hour each day traveling. This amounts to over 333 hours annually, roughly equivalent to two weeks spent commuting.
-
22% of commutes exceed 30 minutes.
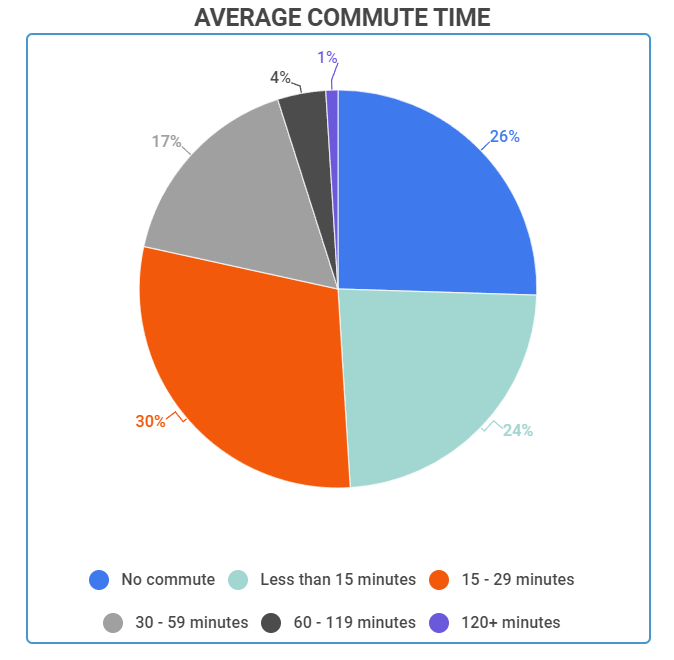
Almost a quarter of Americans experience commutes longer than 30 minutes, while just under 24% manage to commute in less than 15 minutes.
Average Commute Time In US
Average commute time % of Americans No commute 26% Less than 15 minutes 24% 15-29 minutes 30% 30-59 minutes 17% 60-119 minutes 4% 120 minutes or more 1%
Average Commute Time by State
Commute times vary significantly across states and cities. For instance, states like New York and New Jersey report nearly double the average commute time compared to states like Montana and South Dakota. Overall, our research highlights:
-
New York State has the longest average commute time at 33.4 minutes.
This high average is largely influenced by New York City, with other states showing significant commute times including: Maryland (32.8 minutes), New Jersey (31.7 minutes), Massachusetts (29.6 minutes), and California (29.4 minutes).
-
South Dakota reports the shortest average commute times at 16.6 minutes.
With commute times significantly lower than New York State, South Dakota benefits from less congestion. Other states with short commute times include: Wyoming (16.9 minutes), North Dakota (17.4 minutes), Montana (17.5 minutes), and Alaska (18 minutes).
Commute Time By State
State Average commute time (in minutes) New York 33.4 Maryland 32.8 New Jersey 31.7 Massachusetts 29.6 California 29.4 Illinois 28.9 Georgia 28.5 Virginia 28.5 Washington 27.9 Florida 27.4 Hawaii 27.4 New Hampshire 26.9 Pennsylvania 26.9 Texas 26.5 Connecticut 26.3 Delaware 26.1 West Virginia 25.4 Arizona 25.3 Tennessee 25.1 Louisiana 25 Colorado 25 Rhode Island 24.8 South Carolina 24.7 Alabama 24.6 Michigan 24.5 North Carolina 24.4 Mississippi 24.3 Nevada 24.1 Maine 23.9 Oregon 23.9 Missouri 23.7 Indiana 23.6 Minnesota 23.5 Ohio 23.4 Kentucky 23.3 Vermont 23.1 New Mexico 21.9 Wisconsin 21.9 Utah 21.6 Oklahoma 21.4 Arkansas 21.2 Idaho 20.9 Kansas 19.4 Iowa 19 Nebraska 18.6 Alaska 18 Montana 17.5 North Dakota 17.4 Wyoming 16.9 South Dakota 16.6
Average Commute Time by City
While some states may not rank among the longest commutes, specific cities often present extreme variations. Factors such as population density and urban infrastructure greatly influence commute times. Our analysis reveals:
-
New York City, NY has the longest average commute at 34.7 minutes.
Consistent with its parent state, NYC displays notably high average commute times, leading many residents to opt for alternative forms of transportation.
Other cities with high commute times include Long Island, NY (33.3 minutes), Washington, DC (32.8 minutes), Newark, NJ (31.1 minutes), and Chicago, IL (30.8 minutes).
Cities With The Longest Commute
City Average commute time (in minutes) New York City, NY 34.7 Long Island, NY 33.3 Washington, DC 32.8 Newark, NJ 31.1 Chicago, IL 30.8 Boston, MA 30.4 Oakland, CA 29.9 San Bernardino, CA 29.8 Baltimore, MD 29.4 Atlanta, GA 29.2 -
Great Falls, MT has the shortest average commute at 15.3 minutes.
This smaller city showcases the benefits of shorter commute times, attracting residents who prefer less time on the road.
Other cities with low commute times include Wichita, KS (19.5 minutes), Omaha, NE (20.2 minutes), Des Moines, IA (20.3 minutes), and Buffalo, NY (20.3 minutes).
Cities With The Shortest Commute
City Average commute time (in minutes) Great Falls, MT 15.3 Wichita, KS 19.5 Omaha, NE 20.2 Des Moines, IA 20.3 Buffalo, NY 20.3 Toledo, OH 20.7 Syracuse, NY 21.2 Dayton, OH 21.3 Rochester, NY 21.3 Provo, UT 21.4
Average Commute Time by Means of Transportation
Although cars remain the most common form of transportation in the U.S., various alternatives are available. Here are insights into different commuting methods:
-
Public transportation in the U.S. takes up to 85% longer than commuting by car.
The average commute by car is approximately 25 minutes, while public transport options like buses and subways take 45 and 47 minutes, respectively.
-
Driving time averages 25 minutes for American commuters. This translates to at least an hour in the car for those commuting to work.
-
Only 23% of Americans carpool to work.
Carpooling is relatively uncommon in the U.S., though it varies by location. In Washington, D.C., for instance, up to 66% of commuters carpool.
-
Subway commuters have the longest average travel time in the U.S. at 47 minutes.
Conversely, walking in major metro areas leads to the shortest commute times of about 12 minutes on average.
Commute Time By Transportation Type
Method of transportation Average commute time (in minutes) Walking 12 Car 25 Bus 45 Subway 47
Other Commuting Statistics
For a broader perspective on commuting in the U.S., here are additional statistics:
-
China has the longest average commute time at 56 minutes.
With its vast population, China’s commuting times significantly exceed those in the U.S., where the average is notably lower. For context, Italy’s average commute time is just 23 minutes.
-
The average American spends over 330 hours per year commuting to work.
This totals nearly 14 days, highlighting the extensive time invested in commuting.
-
The average American will commute for over a year of their lifetime.
If you work for at least 45 years, you will spend over 11,000 hours commuting, equivalent to approximately 450 days, or more than a full year.
Average Commute Time Statistics FAQ
-
How much does the average American commute?
It takes the average American 27.6 minutes to commute. Individual commute times vary based on location, traffic, and various other factors.
For example, rural states like South Dakota have average commute times as low as 16.6 minutes, while New York City nearly doubles that average.
-
What is the average commuting distance?
The average commuting distance is 41 miles to and from work. However, distance does not always correlate with longer commute times. Factors like speed limits and traffic conditions play a significant role.
Urban areas may experience more delays due to traffic and construction than rural locations, which often have fewer obstacles.
-
A reasonable commute is generally considered to be less than 50 miles from your employer. However, actual commute times can vary widely based on geographic and infrastructural factors.
Ultimately, what constitutes a reasonable commute depends on individual preferences and circumstances, making it a crucial consideration when selecting a new job.
-
What does average commute time mean?
Average commute time refers to the average duration a commuter spends traveling from home to their workplace. This metric typically accounts for one direction of travel, and while it provides a general idea, individual experiences may vary.
Conclusion
Although daily commutes can be tedious, they remain an integral part of life for the majority of Americans. The average American spends about 27.6 minutes commuting each way. However, commute durations can differ widely based on geographic location.
For instance, New Yorkers typically spend 33.4 minutes commuting, while residents in South Dakota only spend about 16.6 minutes. These variations can greatly influence your daily experience and should be taken into account when considering career opportunities.
All this commuting time can contribute to stress, making it essential to factor commute length into your job decisions for a more balanced lifestyle.
Sources:
-
TitleMax. “100 U.S. Cities, Ranked by Commute Time.” Accessed on July 25th, 2022.
-
Jerry. “How Many Miles Do People Usually Commute for and Is Yours Too Long?” Accessed on July 25th, 2022.
-
Census. “Who Drives to Work? Commuting by Automobile in the United States.” Accessed on July 25th, 2022.
-
Statista. “How Long Do Americans Commute For?” Accessed on July 25th, 2022.
-
TitleMax. “The Average Commute to Work by State and City.” Accessed on July 25th, 2022.
-
Governing. “Average Commute Times for Metro Areas.” Accessed on July 25th, 2022.
-
Jerry. “States With the Highest Percentage of Communal Commuters.” Accessed on July 25th, 2022.
-
The Geography of Transport Systems. “Average Daily Commuting Time, Selected Countries.” Accessed on July 25th, 2022.
- Commute Statistics
Author
Jack Flynn is a writer for Zippia. In his professional career he’s written over 100 research papers, articles and blog posts. Some of his most popular published works include his writing about economic terms and research into job classifications. Jack received his BS from Hampshire College.