Find a Job You Really Want In
Top Cities for Tech Careers in 2026
Are you aspiring to fix computers or perhaps design technology for organizations like NASA, but uncertain about where to start your job search? While California has long been the epicenter of the tech industry, numerous other cities across the U.S. are emerging as viable tech hubs, offering unique lifestyles and opportunities. If you’re looking to pursue a tech career, rest assured that you have plenty of options beyond Silicon Valley.
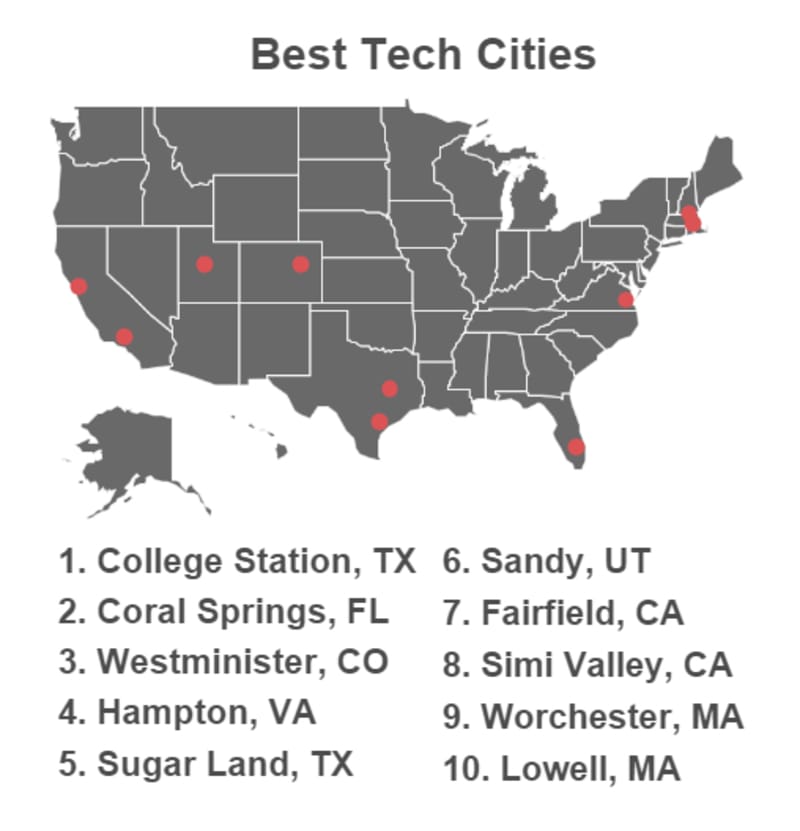
The Best Tech Cities
- College Station, Texas
- Coral Springs, Florida
- Westminster, Colorado
- Hampton, Virginia
- Sugar Land, Texas
- Sandy, Utah
- Fairfield, California
- Simi Valley, California
- Worcester, Massachusetts
- Lowell, Massachusetts
In addition to our top 10 tech cities, we have compiled a comprehensive list of 100 tech cities later in this article. If these locations don’t resonate with you, there are still ample options to explore, allowing you the flexibility to pursue a tech career in a city that suits your preferences.
How We Determined This
We ranked over 300 cities based on:
- Growth in tech jobs
- Overall percentage of tech jobs
We first assessed the growth in tech jobs to identify cities experiencing significant increases in job opportunities. A rapid increase in job availability often correlates with a more favorable job market, which was weighted heavily in our analysis.
Data on tech jobs was sourced from the Census Bureau’s ACS, focusing on residents employed in fields such as computer science and engineering. This analysis considers local employment, acknowledging that some workers may commute to nearby cities.
Next, we examined the overall percentage of tech workers within each city. While growth figures are impressive, a substantial increase in a small workforce may not be as impactful. A robust tech community is indicative of potential future startups, growth, and valuable collaboration.
1. College Station, Texas

Percent Tech Jobs: 14.40%
Total Tech Jobs: 7,763
Tech Growth: 82.66%
College Station tops our list of best tech cities, showcasing significant growth in the tech sector, boasting a total of 7,763 tech jobs.
2. Coral Springs, Florida
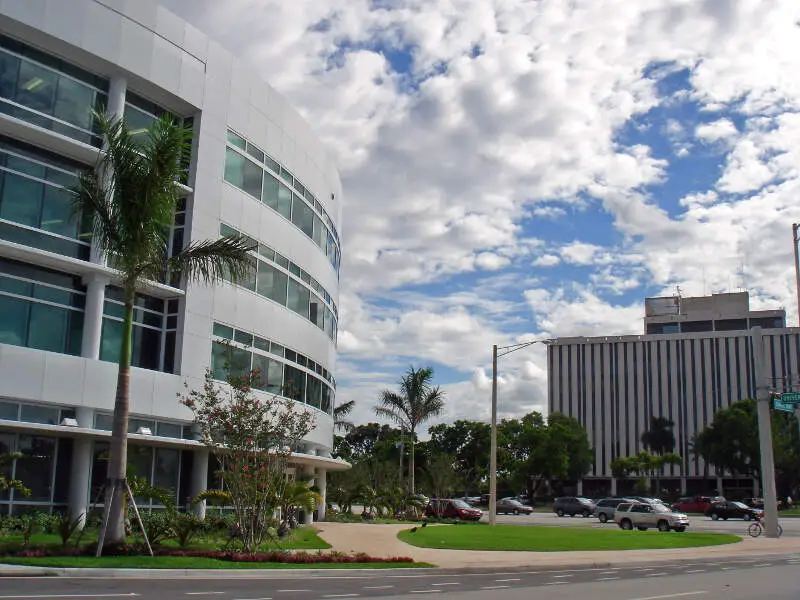
Percent Tech Jobs: 9.20%
Total Tech Jobs: 6,247
Tech Growth: 163.25%
If you’re considering a move to the East Coast, Coral Springs has witnessed the third highest tech growth in the nation at 163.25%, offering 6,247 tech job opportunities.
3. Westminster, Colorado

Percent Tech Jobs: 10.60%
Total Tech Jobs: 6,941
Tech Growth: 61.98%
Westminster secures the third position with 6,941 tech jobs, representing 10.6% of its workforce, and showcasing a healthy growth rate of 61.98% in the tech sector.
4. Hampton, Virginia

Percent Tech Jobs: 11.30%
Total Tech Jobs: 6,883
Tech Growth: 59.85%
Hampton ranks fourth, with 6,883 tech jobs constituting 11.3% of the workforce, experiencing a growth of 59.85% in the tech industry.
5. Sugar Land, Texas

Percent Tech Jobs: 12.80%
Total Tech Jobs: 7,533
Tech Growth: 47.07%
Sugar Land is another Texas city on the list, with 12.8% of its workforce in tech, translating to 7,533 available jobs, making it a promising destination for tech professionals.
6. Sandy, Utah
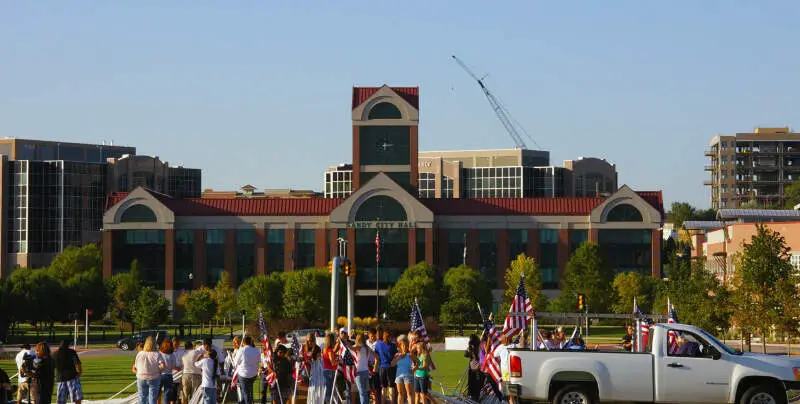
Percent Tech Jobs: 9.50%
Total Tech Jobs: 4,906
Tech Growth: 60.12%
Sandy has recently seen a healthy growth rate of 60.12%, with 4,906 total tech jobs, accounting for 9.5% of its workforce.
7. Fairfield, California

Percent Tech Jobs: 7.10%
Total Tech Jobs: 4,083
Tech Growth: 108.96%
Fairfield has recorded impressive tech growth of 108.96%, although it has a total of 4,083 tech jobs, indicating potential for future expansion.
8. Simi Valley, California

Percent Tech Jobs: 9.10%
Total Tech Jobs: 6,054
Tech Growth: 46.66%
Simi Valley ranks eighth, offering 6,054 tech jobs with a growth rate of 46.66%, representing 9.1% of the local workforce.
9. Worcester, Massachusetts
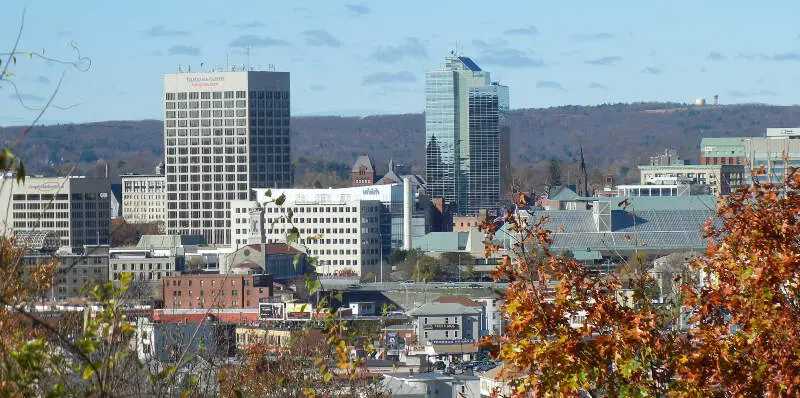
Percent Tech Jobs: 7.00%
Total Tech Jobs: 6,226
Tech Growth: 67.77%
Worcester holds the ninth spot with 6,226 tech jobs, reflecting a growth rate of 67.77%, indicative of the city’s evolving tech landscape.
10. Lowell, Massachusetts

Percent Tech Jobs: 7.60%
Total Tech Jobs: 4,239
Tech Growth: 53.92%
Lowell, Massachusetts, rounds out our list with 4,239 tech jobs, which constitutes 7.6% of its workforce, showcasing a growth rate of 53.92%.
Summary of Best Tech Cities
Often labeled as “techies,” those in the tech field are more complex than stereotypes suggest. Your job search should reflect your unique skills and aspirations. With our curated list of the best cities for tech jobs, we have simplified your search, allowing you to pinpoint your ideal location with ease.
Complete List of the Best Tech Cities
| State | City | Percent Of Tech Jobs | Total No. Of Tech Jobs | Tech Growth |
|---|---|---|---|---|
| Texas | College Station | 14.35% | 7,763 | 82.66% |
| Florida | Coral Springs | 9.23% | 6,247 | 163.25% |
| Colorado | Westminster | 10.57% | 6,941 | 61.98% |
| Virginia | Hampton | 11.28% | 6,883 | 59.85% |
| Texas | Sugar Land | 12.77% | 7,533 | 47.07% |
| Utah | Sandy | 9.48% | 4,906 | 60.12% |
| California | Fairfield | 7.14% | 4,083 | 108.96% |
| California | Simi Valley | 9.13% | 6,054 | 46.66% |
| Massachusetts | Worcester | 6.99% | 6,226 | 67.77% |
| Massachusetts | Lowell | 7.62% | 4,239 | 53.92% |
| California | San Buenaventura | 7.88% | 4,411 | 48.27% |
| Idaho | Meridian | 7.38% | 4,054 | 54.61% |
| Illinois | Peoria | 9.56% | 4,984 | 34.38% |
| Washington | Renton | 9.77% | 5,644 | 32.09% |
| Texas | Round Rock | 11.61% | 8,133 | 28.77% |
| Arizona | Chandler | 12.83% | 17,651 | 26.82% |
| California | Hayward | 8.94% | 7,043 | 32.31% |
| Florida | Brandon | 8.56% | 5,132 | 33.99% |
| Ohio | Cincinnati | 7.95% | 11,907 | 34.60% |
| North Carolina | High Point | 6.75% | 3,584 | 53.49% |
| California | Richmond | 6.07% | 3,506 | 68.64% |
| California | Clovis | 6.79% | 3,497 | 48.24% |
| Florida | Miami Beach | 5.30% | 2,868 | 122.50% |
| Michigan | Livonia | 10.48% | 5,307 | 28.16% |
| Arizona | Tempe | 10.56% | 11,690 | 26.79% |
| Minnesota | St. Paul | 7.98% | 12,859 | 31.64% |
| Louisiana | Baton Rouge | 7.03% | 7,463 | 37.31% |
| New York | Albany | 8.66% | 4,345 | 29.74% |
| Missouri | Columbia | 7.38% | 4,844 | 33.66% |
| Washington | Spokane | 5.62% | 6,054 | 63.89% |
| Illinois | Aurora | 6.40% | 6,890 | 46.75% |
| Texas | McKinney | 11.01% | 10,659 | 24.49% |
| California | San Mateo | 15.64% | 8,955 | 21.39% |
| Connecticut | Stamford | 6.63% | 4,770 | 43.03% |
| Minnesota | Rochester | 11.38% | 7,209 | 22.64% |
| California | Burbank | 6.31% | 3,331 | 44.76% |
| Colorado | Arvada | 10.40% | 7,001 | 22.93% |
| Georgia | Sandy Springs | 13.36% | 8,490 | 21.06% |
| Michigan | Lansing | 7.08% | 3,926 | 31.88% |
| California | Palmdale | 4.88% | 3,238 | 74.09% |
| Maryland | Baltimore | 8.12% | 23,237 | 27.60% |
| California | Oxnard | 4.64% | 4,831 | 87.32% |
| California | Irvine | 17.70% | 24,198 | 17.99% |
| California | Oakland | 9.23% | 21,764 | 24.41% |
| Washington | Seattle | 16.74% | 75,672 | 17.46% |
| North Carolina | Wilmington | 5.97% | 3,582 | 36.98% |
| Nevada | North Las Vegas | 3.90% | 4,281 | 134.70% |
| Nevada | Enterprise | 4.70% | 4,767 | 63.20% |
| Oregon | Gresham | 5.41% | 2,915 | 46.41% |
| Florida | Davie town | 4.97% | 2,967 | 55.67% |
| Iowa | Des Moines | 5.89% | 6,630 | 36.42% |
| Ohio | Columbus | 7.86% | 37,400 | 25.59% |
| Texas | Killeen | 4.43% | 2,723 | 73.22% |
| New Jersey | Jersey City | 13.33% | 18,906 | 17.67% |
| Georgia | Roswell | 8.73% | 4,523 | 22.41% |
| Michigan | Ann Arbor | 17.56% | 11,175 | 15.11% |
| Oklahoma | Broken Arrow | 7.51% | 4,109 | 24.89% |
| Connecticut | New Haven | 6.73% | 4,134 | 29.43% |
| Arizona | Tucson | 6.42% | 15,982 | 30.17% |
| Utah | West Valley City | 4.67% | 3,313 | 55.91% |
| Missouri | St. Louis | 7.88% | 12,482 | 22.78% |
| Nevada | Reno | 6.16% | 8,263 | 30.41% |
| South Carolina | North Charleston | 7.23% | 4,093 | 24.52% |
| Texas | Denton | 6.47% | 5,073 | 29.48% |
| Kentucky | Lexington-Fayette | 6.73% | 11,596 | 27.86% |
| Rhode Island | Providence | 6.03% | 4,695 | 31.44% |
| California | Huntington Beach | 7.62% | 8,014 | 22.50% |
| Utah | Salt Lake City | 9.20% | 10,371 | 19.45% |
| California | Stockton | 3.98% | 5,125 | 65.86% |
| California | Elk Grove | 8.71% | 6,980 | 20.32% |
| Alabama | Huntsville | 13.93% | 13,144 | 14.30% |
| North Carolina | Fayetteville | 3.84% | 3,006 | 64.53% |
| New Jersey | Newark | 3.40% | 4,379 | 102.64% |
| California | San Francisco | 13.68% | 73,437 | 13.84% |
| Pennsylvania | Allentown | 3.55% | 1,950 | 78.74% |
| New Jersey | Elizabeth | 3.03% | 1,929 | 108.99% |
| Iowa | Cedar Rapids | 7.22% | 5,227 | 22.27% |
| Oregon | Salem | 5.15% | 4,164 | 33.85% |
| Texas | Corpus Christi | 3.90% | 5,871 | 57.82% |
| California | Ontario | 3.12% | 2,881 | 102.74% |
| Louisiana | New Orleans | 5.65% | 9,946 | 29.72% |
| California | Mission Viejo | 9.37% | 4,793 | 17.10% |
| California | Salinas | 2.97% | 2,014 | 105.51% |
| Oklahoma | Norman | 8.78% | 5,567 | 17.85% |
| California | East Los Angeles | 2.24% | 1,197 | 208.51% |
| Florida | Clearwater | 4.41% | 2,444 | 41.03% |
| Texas | Frisco | 14.79% | 13,888 | 12.05% |
| Utah | West Jordan | 7.99% | 4,823 | 18.01% |
| Iowa | Davenport | 4.47% | 2,284 | 39.10% |
| Georgia | Augusta-Richmond | 4.07% | 3,436 | 46.03% |
| Texas | Brownsville | 1.41% | 1,023 | 246.78% |
| Texas | Irving | 12.50% | 16,806 | 12.97% |
| Arizona | Phoenix | 5.50% | 45,985 | 28.39% |
| Florida | Hialeah | 2.55% | 3,143 | 103.83% |
| California | San Bernardino | 2.73% | 2,380 | 92.71% |
| Oklahoma | Oklahoma City | 6.29% | 20,267 | 24.47% |
| Oregon | Portland | 8.72% | 32,442 | 16.61% |
| South Carolina | Charleston | 8.34% | 6,504 | 16.96% |
| California | Fullerton | 6.89% | 4,909 | 20.88% |
Author
Amanda Postma is a writer for the Zippia Career Advice blog with a focus on creating entertaining content to help you through your job search. She received her BA from the University Of Missouri-Columbia.


