Find a Job You Really Want In
For many millennials, achieving financial stability remains a challenge, especially in the wake of rising living costs and evolving job markets. As individuals aged 25-40, millennials often find themselves earning less and accumulating fewer assets compared to previous generations. However, the state in which they reside plays a significant role in shaping their quality of life.
After highlighting the states where it’s most challenging for millennials, we now turn our attention to those where they are thriving.
In this article, we break down the criteria used to determine the rankings and present the complete list of states. First, let’s explore the top 10 states where millennials can truly flourish.
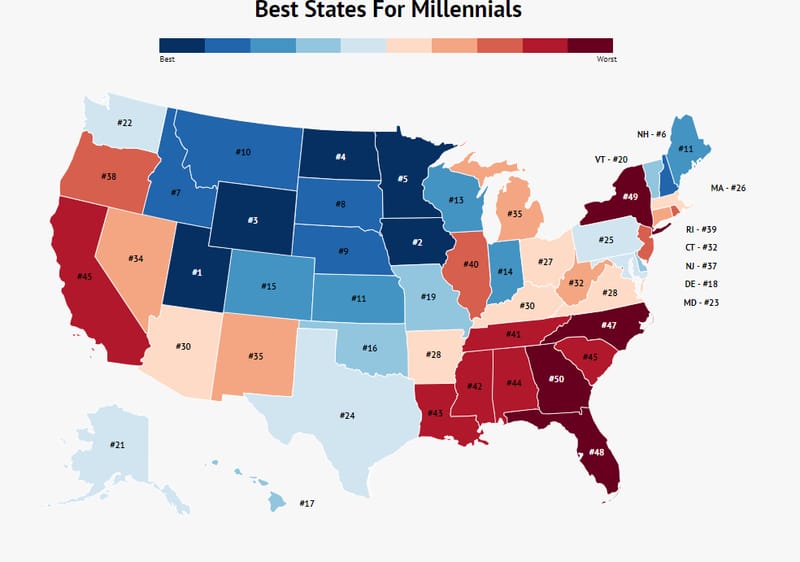
The 10 Best States for Millennials in 2026
If you’re looking to thrive as a millennial, consider heading west. Of the top ten, only New Hampshire is coastal, with the majority of states offering a low cost of living and high homeownership rates, making them attractive for millennials.
Continue reading to discover why these states are the best options for millennials and to view the complete list.
How We Determined the Best States for Millennials
Each state was evaluated and ranked from 1 to 50 across four key categories:
- Millennial Unemployment Rate
- Average Student Loan Debt
- Millennial Home Ownership Rates
- Percentage of Millennials Living in Poverty
We calculated an overall score based on these categories, with each factor weighted equally. A lower score indicated a better ranking. For instance, with 43% homeownership among millennials, Utah ranks first for this category.
Data from the American Community Survey was used to gather information on unemployment and poverty rates for those aged 25 to 34. This data also provided insights into millennial homeownership by state.
To determine average student loan debt, we analyzed reports from the U.S. Department of Education, calculating the average debt for borrowers aged 25 to 34.
If your state isn’t featured in the top ten, scroll to the end of the post to see its ranking. Otherwise, let’s delve into the specifics of why these states are ideal for millennials.
1. Utah

Unemployment Rate: 4%
Home Ownership Rate: 43%
Poverty Rate: 10%
Average Student Loan Debt: $28,522
Utah tops the list with a remarkable 10% poverty rate among millennials—the best in the nation—and a strong homeownership rate. It’s an appealing place for millennials looking to thrive.
2. Iowa

Unemployment Rate: 4%
Home Ownership Rate: 43%
Poverty Rate: 11%
Average Student Loan Debt: $29,314
Iowa is a close second, known for its low poverty rate and high employment among millennials, contributing to robust homeownership levels.
3. Wyoming

Unemployment Rate: 4.6%
Home Ownership Rate: 41%
Poverty Rate: 12%
Average Student Loan Debt: $26,373
Ranked third, Wyoming offers millennials low student debt and favorable homeownership rates, making it an attractive option.
4. North Dakota

Unemployment Rate: 3%
Home Ownership Rate: 36%
Poverty Rate: 10%
Average Student Loan Debt: $28,173
North Dakota stands out with the lowest millennial unemployment rate, making it a stable environment for young professionals.
5. Minnesota

Unemployment Rate: 4.5%
Home Ownership Rate: 45%
Poverty Rate: 11.5%
Average Student Loan Debt: $32,322
Millennials in Minnesota enjoy the highest homeownership rates compared to their peers nationwide, alongside favorable unemployment and poverty rates.
6. New Hampshire
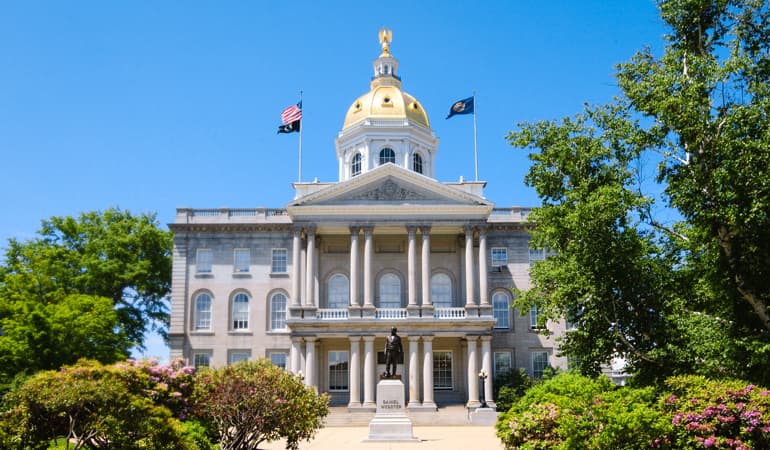
Unemployment Rate: 4%
Home Ownership Rate: 37%
Poverty Rate: 10%
Average Student Loan Debt: $31,736
New Hampshire is ideal for beach-loving millennials, known for its low poverty rate, which enhances its appeal.
7. Idaho

Unemployment Rate: 5%
Home Ownership Rate: 39%
Poverty Rate: 14%
Average Student Loan Debt: $28,205
Idaho is a hidden gem for millennials, offering decent homeownership opportunities and manageable student debt.
8. South Dakota

Unemployment Rate: 4%
Home Ownership Rate: 42%
Poverty Rate: 16%
Average Student Loan Debt: $31,034
South Dakota’s position is bolstered by its favorable neighboring states and a solid environment for millennials.
9. Nebraska
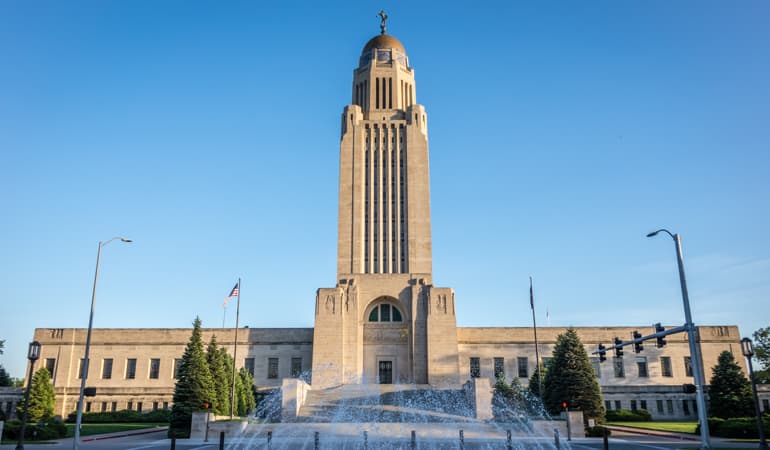
Unemployment Rate: 3.5%
Home Ownership Rate: 38%
Poverty Rate: 13%
Average Student Loan Debt: $31,995
Nebraska offers low unemployment rates and a favorable homeownership climate, making it a great place for millennials.
10. Montana

Unemployment Rate: 5%
Home Ownership Rate: 35%
Poverty Rate: 12%
Average Student Loan Debt: $29,930
Montana, often dubbed “The Last Best Place,” rounds out our top 10 with favorable conditions for millennials, including low unemployment and manageable student loans.
Summary of the Best States to Be a Millennial
In conclusion, these ten states provide millennials with the best opportunities for success in 2026. The western states dominate the rankings, thanks to their high homeownership rates and low poverty levels. If your state didn’t make the top list, see how it compares below. For insights into the least favorable states for millennials, check out our article on the worst states to be a millennial.
Check Your State’s Ranking:
| Rank | State | Unemployment Rate | Home Owner Rates | Poverty Rate | Student Loan Debt Per Borrower |
|---|---|---|---|---|---|
| 1 | Utah | 4 | 43.03% | 10 | 28,522 |
| 2 | Iowa | 4 | 43.81% | 11 | 29,314 |
| 3 | Wyoming | 4 | 41.86% | 12 | 26,373 |
| 4 | North Dakota | 2 | 36.49% | 10 | 28,173 |
| 5 | Minnesota | 4 | 45.06% | 11 | 32,322 |
| 6 | New Hampshire | 4 | 37.53% | 10 | 31,736 |
| 7 | Idaho | 5 | 39.29% | 14 | 28,205 |
| 8 | South Dakota | 4 | 42.63% | 16 | 31,034 |
| 9 | Nebraska | 3 | 38.17% | 13 | 31,995 |
| 10 | Montana | 5 | 35.66% | 12 | 29,930 |
| 11 | Kansas | 4 | 37.24% | 14 | 30,237 |
| 11 | Maine | 5 | 41.28% | 12 | 32,087 |
| 13 | Wisconsin | 5 | 36.3% | 14 | 31,210 |
| 14 | Indiana | 6 | 40.35% | 17 | 30,626 |
| 15 | Colorado | 5 | 33.89% | 11 | 33,439 |
| 16 | Oklahoma | 5 | 37.32% | 20 | 28,644 |
| 17 | Hawaii | 5 | 21.09% | 10 | 32,038 |
| 18 | Delaware | 6 | 39.89% | 15 | 34,256 |
| 19 | Missouri | 6 | 38.23% | 17 | 33,309 |
| 20 | Vermont | 4 | 34.63% | 13 | 34,482 |
| 21 | Alaska | 7 | 32.93% | 14 | 29,921 |
| 22 | Washington | 6 | 30.34% | 14 | 31,937 |
| 23 | Maryland | 6 | 36.45% | 11 | 39,484 |
| 24 | Texas | 5 | 31.38% | 20 | 30,240 |
| 25 | Pennsylvania | 6 | 38.16% | 16 | 35,843 |
| 26 | Massachusetts | 5 | 29.35% | 13 | 35,279 |
| 27 | Ohio | 6 | 35.52% | 19 | 33,300 |
| 28 | Virginia | 6 | 34.05% | 13 | 37,571 |
| 28 | Arkansas | 7 | 35.39% | 21 | 31,156 |
| 30 | Arizona | 6 | 32.01% | 19 | 31,824 |
| 30 | Kentucky | 7 | 38.21% | 21 | 32,291 |
| 32 | Connecticut | 7 | 33.67% | 12 | 34,292 |
| 32 | West Virginia | 8 | 41.17% | 23 | 31,486 |
| 34 | Nevada | 7 | 30.01% | 17 | 30,035 |
| 35 | New Mexico | 8 | 36.33% | 26 | 28,439 |
| 35 | Michigan | 8 | 41.4% | 18 | 35,468 |
| 37 | New Jersey | 7 | 31.04% | 13 | 35,011 |
| 38 | Oregon | 7 | 28.01% | 15 | 33,419 |
| 39 | Rhode Island | 7 | 28.61% | 16 | 32,341 |
| 40 | Illinois | 7 | 35.54% | 16 | 37,470 |
| 41 | Tennessee | 7 | 35.19% | 20 | 34,283 |
| 42 | Mississippi | 10 | 37.66% | 27 | 33,261 |
| 43 | Louisiana | 8 | 37.04% | 26 | 33,860 |
| 44 | Alabama | 8 | 37.58% | 23 | 34,861 |
| 45 | California | 7 | 23.43% | 17 | 34,448 |
| 45 | South Carolina | 7 | 36.74% | 22 | 37,249 |
| 47 | North Carolina | 7 | 32.7% | 20 | 36,246 |
| 48 | Florida | 7 | 29.33% | 19 | 35,709 |
| 49 | New York | 7 | 24.08% | 19 | 38,734 |
| 50 | Georgia | 7 | 31.61% | 20 | 37,284 |
You’ve Seen the Best States, Now Explore the Worst
Author
Kathy is the head of content at Zippia with a knack for engaging audiences. Prior to joining Zippia, Kathy worked at Gateway Blend growing audiences across diverse brands. She graduated from Troy University with a degree in Social Science Education.