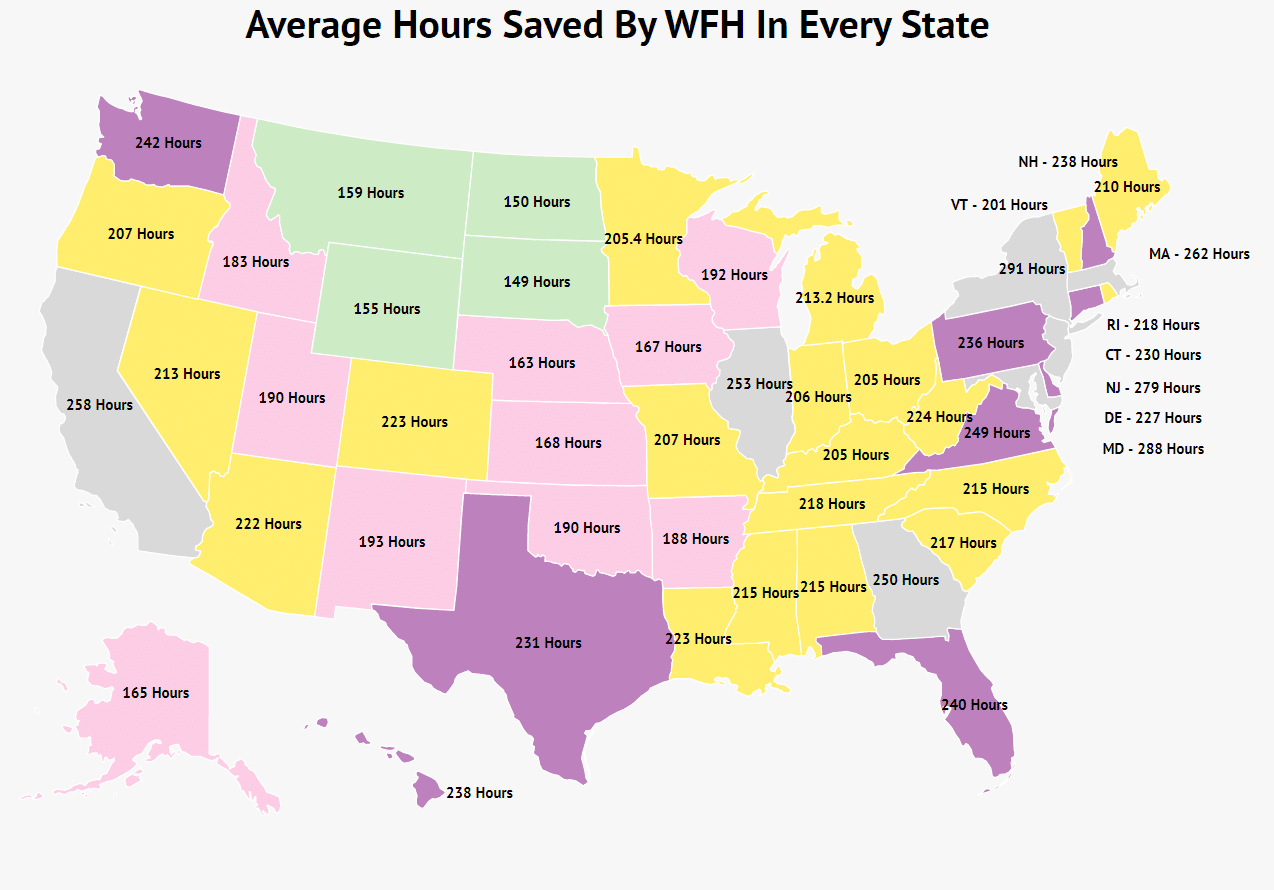
New Yorkers saved the most time on their commutes during the Pandemic, at an average of 291 hours per year.
Workers in South Dakota must not have a lot of traffic, as they only saved 149 hours.
Workers in New York City, NY saved a whopping 360 hours on their commute times.
While workers in Lubbock, TX only saved an average of 144 hours.
In March of 2020, the unexpected and unprecedented American Work-From-Home experiment began.
Many workers found not only could they work from- they were just as productive and saving time and money to boot.
In fact, as the pandemic enters the final stage, many workers are mourning the time they gained- and will soon lose- from cutting out their daily commute.
Instead of a morning spent calmly with a cup of coffee or having breakfast with their children, they will now once again be on a congested freeway being reminded of just how much they dislike other people.
We hit the data to understand the average time saved by workers working remotely in the past year–and the time they will lose commuting when they return to the office.
First, we will examine the time saved by state, and then the time saved by city.
The States That Saved The Most Time
| Rank | State | Hours Saved |
|---|---|---|
| 1 | New York | 291 |
| 2 | Maryland | 288 |
| 3 | New Jersey | 279 |
| 4 | Massachusetts | 262 |
| 5 | California | 258 |
| 6 | Illinois | 253 |
| 7 | Georgia | 250 |
| 8 | Virginia | 249 |
| 9 | Washington | 242 |
| 10 | Florida | 240 |
Unsurprisingly, densely crowded and highly urban states saved the most time by not commuting. As you can see below, western states with spare populations saved significantly fewer hours. Although even South Dakota saved 149 hours– the equivalent of over 3 and a half work weeks.
The States That Saved The Least Time
| Rank | State | Hours Saved |
|---|---|---|
| 1 | South Dakota | 149 |
| 2 | North Dakota | 150 |
| 3 | Wyoming | 155 |
| 4 | Montana | 159 |
| 5 | Nebraska | 163 |
| 6 | Alaska | 165 |
| 7 | Iowa | 167 |
| 8 | Kansas | 168 |
| 9 | Idaho | 183 |
| 10 | Arkansas | 188 |
While states are great at providing a big-picture look at commutes, city-level data can provide a more accurate look for an individual’s commute. After all workers in New York City are dealing with far greater traffic for example than those in Albany, New York.
While some cities more or less time, they still saved valuable hours for workers to spend doing things they probably prefer to rush hour. You can see a more in-depth breakdown for the full 150 cities, in addition to our methodology, below.
How We Determined This
For simplicity’s sake, we assumed one year of work from home. While some remote workers may have worked slightly more or slightly less, in general, it’s a good benchmark.
From there, we turned to US 5-year American Community Survey, to find the average commute in each state and the 150 cities with the most workers. We then doubled the number (since commuting typically requires you to go to and from work), giving us the average round-trip commute.
That number was then multiplied by 260, assuming a standard Monday-to-Friday work schedule, which gave us the average early commute in minutes. We simply divided that by 60 to get the number of hours saved by commuting in each geography.
The Cat’s In The Cradle And Silver Spoon
Many workers struggle to achieve a work-life balance. To put that less politely, many workers flat out spend too much time working and not enough time living.
A long commute can contribute to a lopsided work-life balance and decrease worker satisfaction.
Many workers, in particular younger workers, cite flexibility and remote work as some of their most desired job benefits.
In fact, for many workers, the pandemic and resulting time working from home may have only increased their desire to have a more flexible work environment.
Regardless, remote work was becoming more common prior to the pandemic and Covid seems to have ramped up the trend. Maybe for some, quiet morning coffee instead of road rage is here to stay after all.
How much time was saved by working remotely in each city, from most to least
| Rank | City | Hours Saved |
|---|---|---|
| 1 | New York City, New York | 360 |
| 2 | Jersey City city, New Jersey | 322 |
| 3 | Santa Clarita city, California | 319 |
| 4 | Moreno Valley city, California | 309 |
| 5 | Fremont city, California | 307 |
| 6 | Newark city, New Jersey | 305 |
| 7 | Chicago city, Illinois | 304 |
| 8 | Yonkers city, New York | 303 |
| 9 | San Francisco city, California | 293 |
| 10 | Fontana city, California | 293 |
| 11 | Philadelphia city, Pennsylvania | 291 |
| 12 | Oakland city, California | 289 |
| 13 | Rancho Cucamonga city, California | 278 |
| 14 | Los Angeles city, California | 277 |
| 15 | Alexandria city, Virginia | 276 |
| 16 | Ontario city, California | 274 |
| 17 | Baltimore City, Maryland | 272 |
| 17 | Riverside city, California | 272 |
| 19 | Stockton city, California | 270 |
| 20 | Long Beach city, California | 269 |
| 21 | San Jose city, California | 268 |
| 21 | Boston city, Massachusetts | 268 |
| 23 | Washington city, District of Columbia | 267 |
| 24 | Tacoma city, Washington | 261 |
| 24 | Huntington Beach city, California | 261 |
| 26 | Chula Vista city, California | 260 |
| 27 | Oceanside city, California | 259 |
| 28 | Frisco city, Texas | 258 |
| 29 | Aurora city, Colorado | 256 |
| 29 | Garland city, Texas | 256 |
| 31 | Miami city, Florida | 254 |
| 31 | McKinney city, Texas | 254 |
| 33 | Arlington CDP, Virginia | 253 |
| 33 | Aurora city, Illinois | 253 |
| 35 | Grand Prairie city, Texas | 252 |
| 36 | Anaheim city, California | 250 |
| 36 | Garden Grove city, California | 250 |
| 38 | Hialeah city, Florida | 250 |
| 38 | Port St. Lucie city, Florida | 250 |
| 40 | Glendale city, Arizona | 249 |
| 41 | Glendale city, California | 248 |
| 42 | Modesto city, California | 245 |
| 43 | Gilbert town, Arizona | 244 |
| 44 | Seattle city, Washington | 242 |
| 45 | Houston city, Texas | 240 |
| 45 | North Las Vegas city, Nevada | 240 |
| 47 | Arlington city, Texas | 237 |
| 48 | Fort Worth city, Texas | 236 |
| 48 | Atlanta city, Georgia | 236 |
| 48 | Lakewood city, Colorado | 236 |
| 51 | Dallas city, Texas | 235 |
| 52 | Fort Lauderdale city, Florida | 234 |
| 53 | Plano city, Texas | 232 |
| 54 | Chesapeake city, Virginia | 231 |
| 55 | Portland city, Oregon | 230 |
| 56 | Oxnard city, California | 229 |
| 57 | Phoenix city, Arizona | 227 |
| 57 | Sacramento city, California | 227 |
| 59 | Las Vegas city, Nevada | 226 |
| 59 | Orlando city, Florida | 226 |
| 61 | Charlotte city, North Carolina | 224 |
| 61 | Denver city, Colorado | 224 |
| 61 | Detroit city, Michigan | 224 |
| 61 | San Juan zona urbana, Puerto Rico | 224 |
| 65 | Santa Ana city, California | 221 |
| 65 | Irvine city, California | 221 |
| 67 | Mesa city, Arizona | 220 |
| 67 | Vancouver city, Washington | 220 |
| 69 | Jacksonville city, Florida | 218 |
| 70 | Nashville-Davidson metropolitan government (balance), Tennessee | 217 |
| 71 | Worcester city, Massachusetts | 215 |
| 72 | San Antonio city, Texas | 214 |
| 72 | Chandler city, Arizona | 214 |
| 74 | Tampa city, Florida | 213 |
| 75 | San Diego city, California | 212 |
| 75 | Austin city, Texas | 212 |
| 77 | St. Louis city, Missouri | 211 |
| 78 | St. Paul city, Minnesota | 211 |
| 78 | Pittsburgh city, Pennsylvania | 211 |
| 80 | New Orleans city, Louisiana | 210 |
| 80 | Irving city, Texas | 210 |
| 82 | Raleigh city, North Carolina | 208 |
| 82 | Cleveland city, Ohio | 208 |
| 84 | Urban Honolulu CDP, Hawaii | 205 |
| 84 | St. Petersburg city, Florida | 205 |
| 86 | Indianapolis city (balance), Indiana | 205 |
| 86 | Virginia Beach city, Virginia | 205 |
| 88 | Henderson city, Nevada | 204 |
| 89 | Newport News city, Virginia | 202 |
| 89 | Cary town, North Carolina | 202 |
| 91 | El Paso city, Texas | 201 |
| 91 | Minneapolis city, Minnesota | 201 |
| 91 | Cincinnati city, Ohio | 201 |
| 91 | Santa Rosa city, California | 201 |
| 95 | Bakersfield city, California | 199 |
| 96 | Spring Valley CDP, Nevada | 198 |
| 97 | Louisville/Jefferson County metro government (balance), Kentucky | 198 |
| 97 | Paradise CDP, Nevada | 198 |
| 97 | Enterprise CDP, Nevada | 198 |
| 100 | Colorado Springs city, Colorado | 197 |
| 100 | Durham city, North Carolina | 197 |
| 102 | Tucson city, Arizona | 195 |
| 103 | Scottsdale city, Arizona | 193 |
| 104 | Milwaukee city, Wisconsin | 192 |
| 104 | Fresno city, California | 192 |
| 106 | Columbus city, Ohio | 191 |
| 106 | Kansas City city, Missouri | 191 |
| 108 | Birmingham city, Alabama | 190 |
| 109 | Albuquerque city, New Mexico | 189 |
| 109 | Richmond city, Virginia | 189 |
| 111 | Memphis city, Tennessee | 188 |
| 111 | Akron city, Ohio | 188 |
| 113 | Oklahoma City city, Oklahoma | 185 |
| 114 | Norfolk city, Virginia | 185 |
| 114 | Baton Rouge city, Louisiana | 185 |
| 116 | Greensboro city, North Carolina | 184 |
| 116 | Fort Wayne city, Indiana | 184 |
| 118 | Augusta-Richmond County consolidated government (balance), Georgia | 183 |
| 119 | Lexington-Fayette urban county, Kentucky | 182 |
| 119 | Buffalo city, New York | 182 |
| 119 | Tempe city, Arizona | 182 |
| 119 | Spokane city, Washington | 182 |
| 123 | Winston-Salem city, North Carolina | 181 |
| 124 | Laredo city, Texas | 179 |
| 125 | Knoxville city, Tennessee | 178 |
| 125 | Fort Collins city, Colorado | 178 |
| 127 | Reno city, Nevada | 176 |
| 128 | Toledo city, Ohio | 175 |
| 128 | Rochester city, New York | 175 |
| 130 | Overland Park city, Kansas | 174 |
| 131 | Montgomery city, Alabama | 172 |
| 132 | Madison city, Wisconsin | 170 |
| 133 | Salt Lake City city, Utah | 169 |
| 134 | Corpus Christi city, Texas | 168 |
| 134 | Chattanooga city, Tennessee | 168 |
| 136 | Fayetteville city, North Carolina | 167 |
| 137 | Omaha city, Nebraska | 166 |
| 137 | Huntsville city, Alabama | 166 |
| 139 | Grand Rapids city, Michigan | 166 |
| 140 | Anchorage municipality, Alaska | 164 |
| 140 | Des Moines city, Iowa | 164 |
| 142 | Lincoln city, Nebraska | 162 |
| 142 | Tallahassee city, Florida | 162 |
| 144 | Tulsa city, Oklahoma | 161 |
| 144 | Wichita city, Kansas | 161 |
| 144 | Little Rock city, Arkansas | 161 |
| 147 | Boise City city, Idaho | 160 |
| 148 | Amarillo city, Texas | 158 |
| 149 | Sioux Falls city, South Dakota | 146 |
| 150 | Lubbock city, Texas | 144 |
Author
Kathy is the head of content at Zippia with a knack for engaging audiences. Prior to joining Zippia, Kathy worked at Gateway Blend growing audiences across diverse brands. She graduated from Troy University with a degree in Social Science Education.