Find a Job You Really Want In
The Paycheck Protection Program (PPP), a crucial initiative under the $2 trillion CARES Act, was designed to support small businesses in maintaining operations and keeping employees on payroll during economic downturns. However, as data emerged regarding the distribution of these loans, some enterprises, including high-profile brands, raised concerns about whether the funds were allocated fairly across the states. This prompted a deeper examination into which states benefitted most from PPP funding.
In this article, we analyze the PPP loan distribution among states, identifying those that received the highest and lowest amounts of funding, and exploring the implications on local economies.
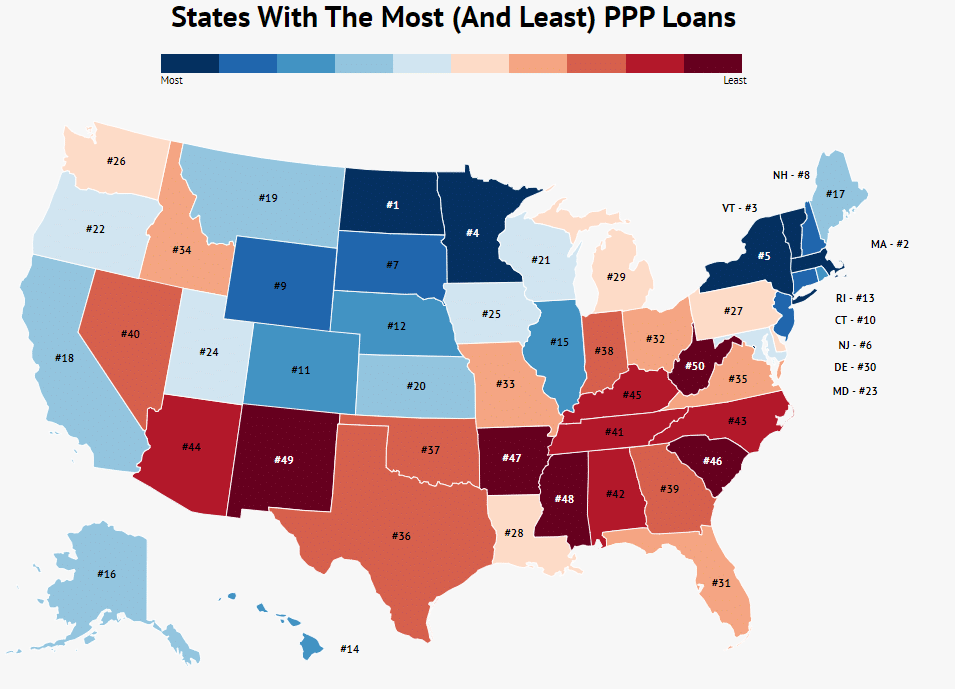
The 10 States That Received the Most in PPP Funds
- North Dakota
- Massachusetts
- Vermont
- Minnesota
- New York
- New Jersey
- South Dakota
- New Hampshire
- Wyoming
- Connecticut
The Northeast and Midwest regions dominated the top 10 list, indicating a trend in the distribution of PPP funds. Below, we provide a detailed breakdown of the funding received by these states.
How We Analyzed the Data
The primary data source for our analysis was the U.S. Treasury’s release of PPP loan level data. We included exact dollar amounts for loans under $150,000 and used the lowest figures for higher loan brackets:
$5-10 million
$2-5 million
$1-2 million
$350,000-1 million
$150,000-350,000
By aggregating these figures, we calculated the total loans per state and divided by each state’s population to assess per capita distributions. We also tracked job retention figures, noting that not all businesses reported their job preservation data, which may evolve as more reports come in.
1. North Dakota

Amount Loaned: $1,358,372,594
Jobs Saved: 176,208
Number of Loans: 19,724
Amount Per Person: $1,782
North Dakota received the highest amount of PPP loans relative to its population, with $1,782 allocated for each resident. The 19,724 loans issued helped secure 176,208 jobs, accounting for approximately 40% of employment in the state.
2. Massachusetts

Amount Loaned: $10,736,321,118
Jobs Saved: 1,143,511
Number of Loans: 112,996
Amount Per Person: $1,545
Massachusetts ranks second, with over $10.7 billion in loans supporting 1,143,511 jobs across 112,996 businesses.
3. Vermont

Amount Loaned: $927,958,248
Jobs Saved: 113,838
Number of Loans: 11,929
Amount Per Person: $1,487
Despite its smaller size, Vermont received $927,958,248 in PPP loans, saving 113,838 jobs, representing 36% of jobs in the state.
4. Minnesota

Amount Loaned: $8,373,169,779
Jobs Saved: 1,090,506
Number of Loans: 98,136
Amount Per Person: $1,485
Minnesota secured $8.37 billion in loans, with a total of 98,136 loans saving over a million jobs at an average of $1,485 per resident.
5. New York

Amount Loaned: $28,682,495,350
Jobs Saved: 3,162,720
Number of Loans: 323,900
Amount Per Person: $1,474
New York received a significant portion of PPP funds, totaling over $28 billion, which helped save more than 3 million jobs.
6. New Jersey

Amount Loaned: $13,001,347,334
Jobs Saved: 1,456,455
Number of Loans: 147,548
Amount Per Person: $1,464
New Jersey followed closely with $13 billion in loans, securing 1,456,455 jobs across 147,548 loans.
7. South Dakota

Amount Loaned: $1,288,486,588
Jobs Saved: 181,633
Number of Loans: 22,507
Amount Per Person: $1,456
South Dakota’s loans, while only 0.33% of the total, amounted to $1,456 per resident, helping to secure 181,633 jobs.
8. New Hampshire

Amount Loaned: $1,959,159,671
Jobs Saved: 209,999
Number of Loans: 23,829
Amount Per Person: $1,441
New Hampshire received nearly $2 billion, securing jobs for 209,999 residents.
9. Wyoming

Amount Loaned: $828,096,606
Jobs Saved: 111,945
Number of Loans: 13,229
Amount Per Person: $1,431
Wyoming received $828 million in loans, translating to $1,431 per resident and saving 111,945 jobs.
10. Connecticut

Amount Loaned: $5,063,612,554
Jobs Saved: 602,575
Number of Loans: 60,948
Amount Per Person: $1,420
Connecticut’s PPP loans totaled over $5 billion, saving 602,575 jobs across the state.
The States That Received the Least
While the above states received substantial funding, several states received significantly less, with the lowest seeing just $772 allocated per resident. Below is a list of the states that received the least funding, along with a comprehensive chart for reference.
The States That Received the Least in PPP Funds
- West Virginia
- New Mexico
- Mississippi
- Arkansas
- South Carolina
- Kentucky
- Arizona
- North Carolina
- Alabama
- Tennessee
Overview of PPP Funding and Jobs Saved by State
| State | Amount Loaned | Jobs Saved | Number of Loans | Amount Per Capita |
|---|---|---|---|---|
| North Dakota | 1,358,372,594 | 176,208 | 19,724 | 1,782 |
| Massachusetts | 10,736,321,118 | 1,143,511 | 112,996 | 1,544 |
| Vermont | 927,958,247 | 113,838 | 11,929 | 1,487 |
| Minnesota | 8,373,169,779 | 1,090,506 | 98,136 | 1,484 |
| New York | 28,682,495,350 | 3,162,720 | 323,900 | 1,474 |
| New Jersey | 13,001,347,334 | 1,456,455 | 147,548 | 1,463 |
| South Dakota | 1,288,486,588 | 181,633 | 22,507 | 1,456 |
| New Hampshire | 1,959,159,671 | 209,999 | 23,829 | 1,440 |
| Wyoming | 828,096,606 | 111,945 | 13,229 | 1,430 |
| Connecticut | 5,063,612,554 | 602,575 | 60,948 | 1,420 |
| Colorado | 7,938,013,494 | 931,911 | 104,403 | 1,378 |
| Nebraska | 2,656,291,172 | 327,536 | 42,497 | 1,373 |
| Rhode Island | 1,441,590,032 | 157,534 | 17,163 | 1,360 |
| Hawaii | 1,888,579,559 | 225,436 | 24,533 | 1,333 |
| Illinois | 16,878,097,943 | 2,162,739 | 202,157 | 1,331 |
| Alaska | 956,776,237 | 114,049 | 11,167 | 1,307 |
| Maine | 1,751,499,180 | 243,371 | 27,198 | 1,302 |
| California | 51,447,516,002 | 6,505,547 | 581,125 | 1,302 |
| Montana | 1,386,898,666 | 215,257 | 23,102 | 1,297 |
| Kansas | 3,766,097,572 | 521,322 | 51,873 | 1,292 |
| Wisconsin | 7,419,630,304 | 999,041 | 85,459 | 1,274 |
| Oregon | 5,311,227,370 | 612,322 | 62,775 | 1,259 |
| Maryland | 7,546,635,031 | 938,434 | 81,317 | 1,248 |
| Utah | 3,993,871,587 | 796,849 | 50,691 | 1,245 |
| Iowa | 3,894,963,766 | 523,205 | 58,463 | 1,234 |
| Washington | 9,256,393,359 | 906,622 | 101,051 | 1,215 |
| Pennsylvania | 15,468,845,586 | 1,821,069 | 165,909 | 1,208 |
| Louisiana | 5,593,386,382 | 800,221 | 73,827 | 1,203 |
| Michigan | 11,959,464,571 | 1,554,024 | 121,137 | 1,197 |
| Delaware | 1,143,358,493 | 136,533 | 12,504 | 1,174 |
| Florida | 25,037,679,363 | 3,224,664 | 393,016 | 1,165 |
| Ohio | 13,625,162,845 | 1,880,625 | 140,278 | 1,165 |
| Missouri | 6,969,656,140 | 936,019 | 91,494 | 1,135 |
| Idaho | 2,023,434,075 | 305,422 | 30,168 | 1,132 |
| Virginia | 9,503,532,022 | 973,961 | 109,227 | 1,113 |
| Texas | 31,097,439,954 | 4,519,665 | 389,387 | 1,072 |
| Oklahoma | 4,197,725,648 | 620,353 | 64,278 | 1,060 |
| Indiana | 7,096,284,777 | 951,593 | 79,147 | 1,054 |
| Georgia | 11,146,482,406 | 1,471,782 | 156,810 | 1,049 |
| Nevada | 3,170,917,392 | 525,691 | 42,147 | 1,029 |
| Tennessee | 6,843,062,837 | 916,996 | 93,287 | 1,001 |
| Alabama | 4,767,238,051 | 672,861 | 65,803 | 972 |
| North Carolina | 9,512,416,544 | 1,246,594 | 121,913 | 906 |
| Arizona | 6,531,794,443 | 1,027,521 | 81,011 | 897 |
| Kentucky | 3,961,015,547 | 599,372 | 48,370 | 886 |
| South Carolina | 4,458,937,343 | 657,957 | 63,168 | 866 |
| Arkansas | 2,602,591,861 | 375,741 | 42,433 | 862 |
| Mississippi | 2,511,877,576 | 412,492 | 45,814 | 844 |
| New Mexico | 1,735,970,028 | 247,939 | 21,927 | 827 |
| West Virginia | 1,384,083,517 | 204,241 | 17,325 | 772 |
In conclusion, the distribution of PPP funds highlighted significant disparities across states, with some experiencing substantial support while others were left wanting. Understanding these trends is crucial as we continue to navigate the evolving landscape of economic recovery.
Author
Kathy is the head of content at Zippia with a knack for engaging audiences. Prior to joining Zippia, Kathy worked at Gateway Blend growing audiences across diverse brands. She graduated from Troy University with a degree in Social Science Education.