Find a Job You Really Want In
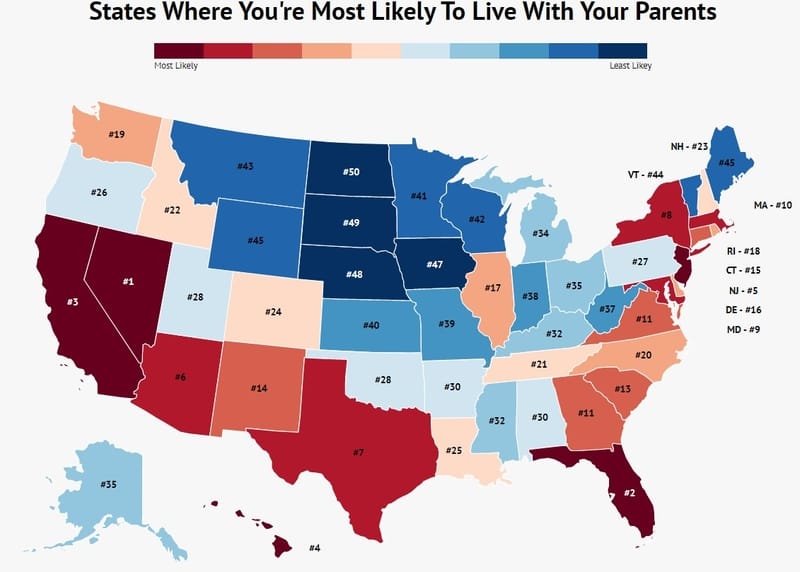
States Where You’re Most Likely to Live With Mom in 2026
Quick Facts
- 34.4% of Americans aged 18 to 34 lived with at least one parent, grandparent, or former guardian.
- 46% of adults in New Jersey live with their parents, the highest rate in the nation.
- Only 14.6% of adults in North Dakota live with their parents.
- Generally, states with higher costs of living show a greater percentage of adults living with their parents, indicating economic challenges.
Are you thinking about living with your parents? For many, the answer is likely “No!” However, the number of multi-generational households in the United States is increasing. Factors such as delayed marriage, rising housing costs, and evolving socio-economic trends are reshaping the traditional narrative of young adults moving out to establish their independence.
Where you reside plays a significant role in the likelihood of living with your parents. We’ve identified the states where adults are most and least likely to cohabitate with their parents. Check out the highlights below, and find the full list at the bottom.
Top States Where You’re Most Likely to Live With Your Parents
These five states have the highest rates of adults living with their parents. A common thread among them is the elevated cost of living. While it might seem that residents simply enjoy family time, economic pressures like soaring rent often drive this trend.
Top States Where You’re Least Likely to Live With Your Parents
If you’re looking to move out, consider the Midwest. These states boast high homeownership and low living costs, contributing to a lower percentage of adults living at home. Continue reading for a detailed breakdown or scroll down for the complete list.
How We Determined the States Where You’re Most Likely to Live With Your Parents
To compile this list, we utilized the Census’s American Community Survey, focusing on states with the highest rates of 18-34 year-olds residing in their parents’ households. The higher the percentage of residents living with their parents, the higher the state’s ranking.
The States Where You’re Most Likely to Live With Your Parents:
1. New Jersey

Percent Living With Their Parents: 46%
In New Jersey, nearly half of young adults live with their parents, making it the state where this phenomenon is most prevalent.
2. Connecticut

Percent Living With Their Parents: 41%
Located between Boston and New York, Connecticut is not only picturesque but also pricey. About 41% of young adults in the state reside with their parents.
3. New York

Percent Living With Their Parents: 40%
The high cost of living in New York, especially in urban areas, means that many young adults find it more practical to live with family rather than alone.
4. Florida

Percent Living With Their Parents: 38%
Known for its beaches and warm climate, Florida also has a significant portion of young adults—38%—living at home.
5. Maryland

Percent Living With Their Parents: 38%
In Maryland, 38% of young residents live with their parents, contributing to the growing trend of multi-generational households.
These five states represent the highest rates of adults living with their parents. Next, we will explore the states where this is least common.
The States Where You’re Least Likely to Live With Your Parents:
1. North Dakota

Percent Living With Their Parents: 14%
North Dakota has the lowest percentage of adults living with their parents, with less than 15% opting for this arrangement, often due to more affordable housing options.
2. South Dakota

Percent Living With Their Parents: 19%
South Dakota mirrors its northern neighbor, with good job prospects and affordable living contributing to its low percentage of adults living at home.
3. Wyoming

Percent Living With Their Parents: 21%
Young adults in Wyoming enjoy a low cost of living, with just 21% choosing to live with their parents.
4. Iowa

Percent Living With Their Parents: 22%
Iowa ranks fourth, with 22% of young adults living with their parents, which is relatively low compared to national averages.
5. Nebraska
Percent Living With Their Parents: 22%
With only 22% of young Nebraskans living with their parents, the state reflects a trend of independence among young adults.
Discover the full list of states ranked from the highest to the lowest percentages of adults living with their parents.
| State | Total 18-To-34 Year Olds | Total Living At Home | % Living With Parents |
|---|---|---|---|
| New Jersey | 1,860,833 | 863,799 | 46.42% |
| Connecticut | 722,142 | 297,131 | 41.15% |
| New York | 4,508,303 | 1,797,334 | 39.87% |
| Florida | 4,168,609 | 1,601,983 | 38.43% |
| Maryland | 1,299,214 | 498,402 | 38.36% |
| California | 9,330,718 | 3,569,850 | 38.26% |
| Delaware | 198,245 | 73,707 | 37.18% |
| Rhode Island | 228,972 | 84,641 | 36.97% |
| Massachusetts | 1,477,566 | 535,641 | 36.25% |
| Mississippi | 641,324 | 231,238 | 36.06% |
| Pennsylvania | 2,624,116 | 944,382 | 35.99% |
| Illinois | 2,863,832 | 1,026,082 | 35.83% |
| Hawaii | 308,956 | 108,183 | 35.02% |
| New Hampshire | 257,502 | 89,213 | 34.65% |
| New Mexico | 462,252 | 158,740 | 34.34% |
| Alabama | 1,035,854 | 355,244 | 34.29% |
| Michigan | 2,098,763 | 713,764 | 34.01% |
| Georgia | 2,255,169 | 766,662 | 34.00% |
| Louisiana | 1,067,035 | 359,037 | 33.65% |
| Texas | 6,446,449 | 2,136,873 | 33.15% |
| South Carolina | 1,028,953 | 335,723 | 32.63% |
| West Virginia | 358,056 | 115,564 | 32.28% |
| Virginia | 1,820,878 | 583,823 | 32.06% |
| Arizona | 1,505,128 | 475,191 | 31.57% |
| Nevada | 651,650 | 201,267 | 30.89% |
| Ohio | 2,413,011 | 737,425 | 30.56% |
| Tennessee | 1,415,829 | 431,493 | 30.48% |
| North Carolina | 2,133,875 | 649,761 | 30.45% |
| Indiana | 1,411,424 | 422,106 | 29.91% |
| Maine | 244,726 | 72,656 | 29.69% |
| Alaska | 180,806 | 52,902 | 29.26% |
| Kentucky | 922,303 | 266,472 | 28.89% |
| Missouri | 1,301,798 | 368,016 | 28.27% |
| Utah | 755,628 | 210,305 | 27.83% |
| Vermont | 120,470 | 33,307 | 27.65% |
| Wisconsin | 1,208,364 | 326,583 | 27.03% |
| Arkansas | 631,513 | 170,504 | 27.00% |
| Minnesota | 1,188,122 | 314,191 | 26.44% |
| Washington | 1,633,665 | 426,926 | 26.13% |
| Oklahoma | 868,329 | 224,153 | 25.81% |
| Oregon | 880,014 | 223,225 | 25.37% |
| Idaho | 356,927 | 88,812 | 24.88% |
| Colorado | 1,271,967 | 309,809 | 24.36% |
| Kansas | 638,786 | 153,944 | 24.10% |
| Montana | 213,410 | 47,080 | 22.06% |
| Nebraska | 414,722 | 90,076 | 21.72% |
| Iowa | 654,251 | 141,948 | 21.70% |
| Wyoming | 129,588 | 26,810 | 20.69% |
| South Dakota | 179,047 | 34,074 | 19.03% |
| North Dakota | 185,584 | 26,844 | 14.46% |
Stay informed with the latest research and insights. Sign up for our weekly newsletter by emailing Kathy Morris at kmorris@zippia.com.
Author
Kathy is the head of content at Zippia with a knack for engaging audiences. Prior to joining Zippia, Kathy worked at Gateway Blend growing audiences across diverse brands. She graduated from Troy University with a degree in Social Science Education.