Find a Job You Really Want In
As October rolls in, it’s time to celebrate Halloween, pumpkins, and the joys of fall.
Every year, Americans indulge in fall festivities, splurging on costumes, candy, and all things spooky. And let’s not forget the highlight of the season, the pumpkin. Nearly half of all Americans will carve a Jack O’Lantern this year, with many more enjoying pumpkin pies and the beloved Pumpkin Spice Latte.
For countless Americans, pumpkins are more than just a seasonal delight; they are a vital part of their livelihood. The U.S. produces over 1.5 billion pounds of pumpkin across more than 15,000 farms.
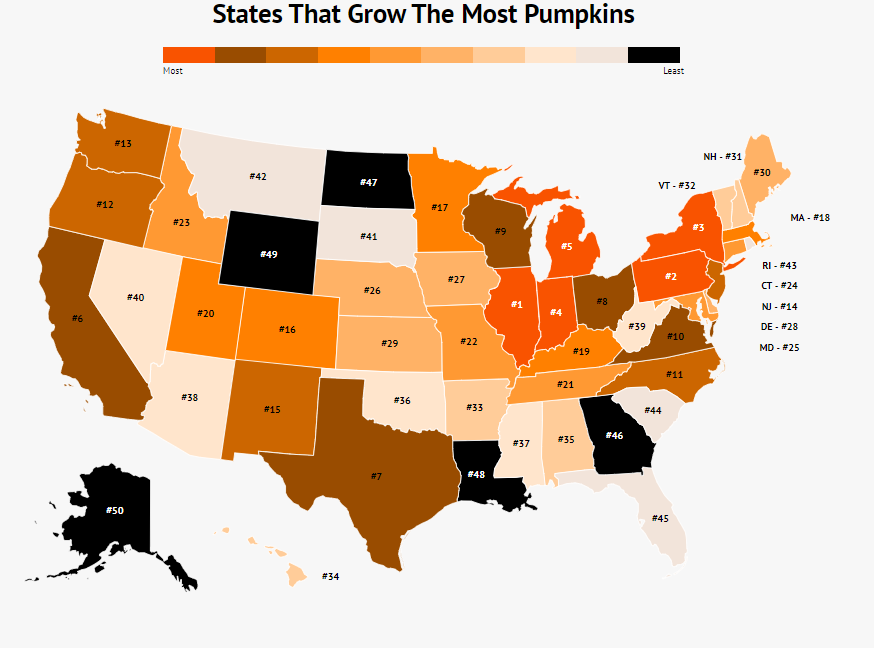
With these impressive figures, we set out to discover which states grow the most pumpkins and share some fun, festive facts.
Top 10 States for Pumpkin Production
Interesting Pumpkin Facts
- 80% of pumpkins are harvested in October.
- 62% of pumpkin acreage is concentrated in just ten states.
- Illinois is the leading state for pumpkin production in the U.S.
- The average cost of a pumpkin is $2.60, though larger carving pumpkins will cost more.
- 44% of Americans plan to carve a Jack-O-Lantern.
- Jack-o’-lanterns were originally carved from turnips or potatoes before Irish immigrants discovered pumpkins were easier to carve.
- The heaviest pumpkin ever recorded weighed 1,810 lb 8 oz and was grown in Minnesota.
- The largest pumpkin pie ever made measured 20 feet in diameter and weighed 3,699 pounds. Imagine the number of forks needed!
- Pumpkins are the only major crop not grown in Antarctica.
- Pumpkin-flavored products generate yearly sales exceeding $414 million, including coffee, beers, baked goods, and more, particularly in Pennsylvania and California.
- Morton, Illinois, proudly claims the title of “pumpkin capital,” producing 85% of the world’s canned pumpkin.
- In total, over 1.5 billion pounds of pumpkins are produced annually across 15,214 farms in the U.S.
Methodology
To determine the number of acres and farms dedicated to pumpkin production, we referenced data from the 2017 U.S. Census of Agriculture. Unfortunately, more recent data is not yet available. Using this information, we ranked each state based on pumpkin acreage to identify the top producers.
To gather fun facts, we consulted various sources including Nielsen Retail Measurement Services, Finder, and more.
The Season of Pumpkins
While other produce may attempt to rival pumpkins (looking at you, apples), pumpkins undeniably reign supreme during fall.
You might bob for apples (which isn’t recommended), or sip apple cider, but can you carve a spooky ghost face in one? Can 80% of them be picked in October? Hardly!
So, sit back, enjoy a pumpkin beer, and embrace the supremacy of pumpkins. If that’s not enough, indulge in a pumpkin doughnut, cookie, cake, or any other pumpkin-flavored treat. Still skeptical? Just ask Illinois and the other states contributing to the impressive 1.5 billion pounds of pumpkins we consume each year.
Ranking of Top Pumpkin-Producing States
| Rank | State | Farms | Acres |
|---|---|---|---|
| 1 | Illinois | 572 | 17,399 |
| 2 | Pennsylvania | 1,305 | 6,871 |
| 3 | New York | 1,234 | 5,592 |
| 4 | Indiana | 432 | 5,330 |
| 5 | Michigan | 983 | 5,123 |
| 6 | California | 643 | 4,386 |
| 7 | Texas | 154 | 3,742 |
| 8 | Ohio | 887 | 3,454 |
| 9 | Wisconsin | 823 | 3,401 |
| 10 | Virginia | 384 | 3,184 |
| 11 | North Carolina | 411 | 2,715 |
| 12 | Oregon | 413 | 2,655 |
| 13 | Washington | 573 | 2,591 |
| 14 | New Jersey | 410 | 2,224 |
| 15 | New Mexico | 143 | 2,223 |
| 16 | Colorado | 242 | 2,010 |
| 17 | Minnesota | 569 | 1,827 |
| 18 | Massachusetts | 403 | 1,735 |
| 19 | Kentucky | 618 | 1,637 |
| 20 | Utah | 212 | 1,415 |
| 21 | Tennessee | 322 | 1,393 |
| 22 | Missouri | 334 | 1,257 |
| 23 | Idaho | 176 | 1,243 |
| 24 | Connecticut | 267 | 1,127 |
| 25 | Maryland | 205 | 1,022 |
| 26 | Nebraska | 141 | 1,015 |
| 27 | Iowa | 355 | 919 |
| 28 | Delaware | 35 | 897 |
| 29 | Kansas | 139 | 750 |
| 30 | Maine | 375 | 673 |
| 31 | New Hampshire | 169 | 489 |
| 32 | Vermont | 170 | 437 |
| 33 | Arkansas | 87 | 363 |
| 34 | Hawaii | 76 | 275 |
| 35 | Alabama | 53 | 272 |
| 36 | Oklahoma | 61 | 268 |
| 37 | Mississippi | 50 | 262 |
| 38 | Arizona | 114 | 241 |
| 39 | West Virginia | 148 | 191 |
| 40 | Nevada | 34 | 173 |
| 41 | South Dakota | 78 | 158 |
| 42 | Montana | 65 | 118 |
| 43 | Rhode Island | 66 | 110 |
| 44 | South Carolina | 61 | 109 |
| 45 | Florida | 73 | 91 |
| 46 | Georgia | 59 | 74 |
| 47 | North Dakota | 36 | 66 |
| 48 | Louisiana | 24 | 45 |
| 49 | Wyoming | 9 | 10 |
| 50 | Alaska | 21 | 4 |
Author
Kathy is the head of content at Zippia with a knack for engaging audiences. Prior to joining Zippia, Kathy worked at Gateway Blend growing audiences across diverse brands. She graduated from Troy University with a degree in Social Science Education.