Find a Job You Really Want In
As we move into 2026, the challenges faced by women in the United States persist, including wage disparities, underrepresentation in leadership roles, and unequal distribution of household responsibilities. Despite progress in many areas, the need for continued advocacy and awareness remains critical.
In light of this, we’ve analyzed the current landscape to identify the cities in Connecticut that present the greatest challenges for women. The findings reveal significant disparities based on location.
Keep reading to discover how your city ranks and the factors contributing to these outcomes for women in Connecticut.
The 10 Worst Cities for Women in Connecticut
The following cities rank as the most challenging environments for women in Connecticut. Continue reading to understand the factors contributing to their ranking, or skip ahead to discover the best cities for women in the state.
Methodology – How We Determined the Worst Cities for Women in Connecticut
Each city was evaluated based on four key metrics:
- Percentage of Women in Management (Lower is worse)
- Percentage of Women in Poverty (Higher is worse)
- Income Ratio: Women’s Earnings per Male Dollar (Lower is worse)
- Uninsured Women (Lower is worse)
To analyze the income gap, we utilized data from the Census Bureau’s American Community Survey. We calculated the ratio of median male income to median female income to determine how much women earn compared to their male counterparts.
For the poverty statistics, we focused on women living without relatives, as these individuals typically have different economic challenges compared to married women or those living with family. This method provides a clearer picture of the financial struggles faced by women alone.
We also considered the percentage of women in management roles to assess leadership representation, as having women in these positions can encourage further advancement for other women.
Finally, we sourced data on uninsured women from the ACS to understand healthcare access issues across cities.
This analysis included only cities in Connecticut with populations exceeding 5,000.
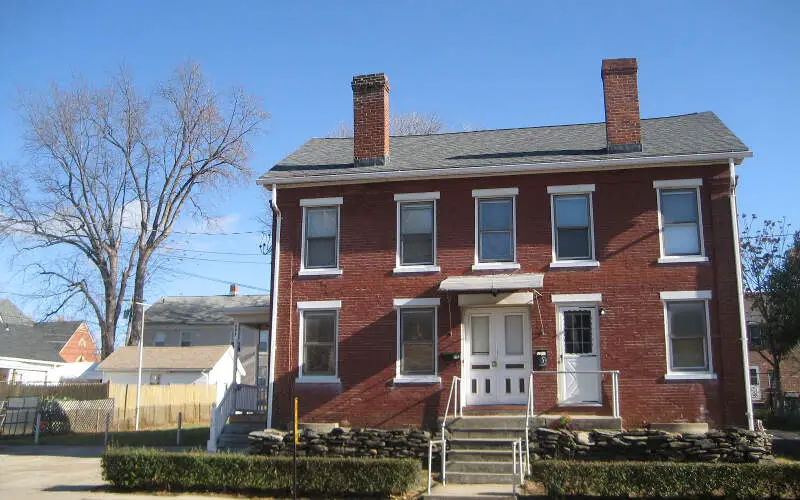
1. Thompsonville
Income Ratio (Women for Male Dollar Earned): $0.57
Women in Management: 42.2%
Women in Poverty: 28.8%
Women Uninsured: 5.8%
Thompsonville ranks as the most challenging city for women in Connecticut, with low income levels and a high percentage of uninsured women. The statistics paint a concerning picture of the struggles faced by women in this community.
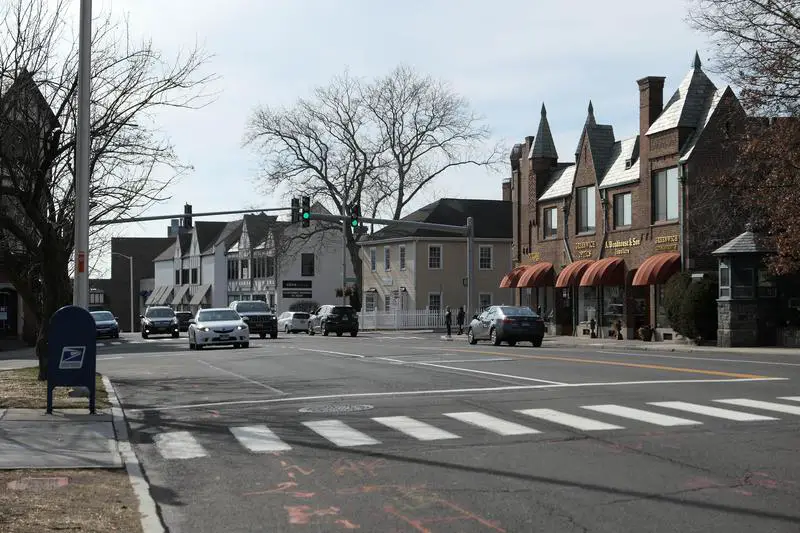
2. Groton

Income Ratio (Women for Male Dollar Earned): $0.61
Women in Management: 36.6%
Women in Poverty: 15.3%
Women Uninsured: 4.8%
Groton is the second most challenging city for women, marked by a significant poverty rate and low representation in management positions.
3. Danbury

Income Ratio (Women for Male Dollar Earned): $0.71
Women in Management: 39.2%
Women in Poverty: 13.1%
Women Uninsured: 11.9%
Women in Danbury face challenges, including a significant percentage living in poverty and limited opportunities for advancement.
4. Greenwich
Income Ratio (Women for Male Dollar Earned): $0.60
Women in Management: 35.5%
Women in Poverty: 9.5%
Women Uninsured: 5.9%
Greenwich ranks fourth, with notable percentages of women lacking health insurance and living in poverty.
5. Willimantic

Income Ratio (Women for Male Dollar Earned): $0.60
Women in Management: 56.5%
Women in Poverty: 32.0%
Women Uninsured: 8.2%
Willimantic offers better management opportunities compared to the previous cities, but a high percentage of women still face poverty.
6. Pawcatuck
Income Ratio (Women for Male Dollar Earned): $0.51
Women in Management: 30.4%
Women in Poverty: 20.1%
Women Uninsured: 1.7%
Pawcatuck ranks sixth, with a concerning income ratio and significant poverty rates among women.
7. Norwich

Income Ratio (Women for Male Dollar Earned): $0.70
Women in Management: 33.8%
Women in Poverty: 15.9%
Women Uninsured: 3.9%
Norwich women endure challenges, including low representation in management and high poverty rates.
8. Winsted
Income Ratio (Women for Male Dollar Earned): $0.81
Women in Management: 24.5%
Women in Poverty: 25.1%
Women Uninsured: 4.6%
Winsted presents a mixed scenario, with a higher earning ratio but significant poverty among women.
9. New London

Income Ratio (Women for Male Dollar Earned): $0.65
Women in Management: 49.9%
Women in Poverty: 31.0%
Women Uninsured: 5.5%
In New London, women face significant economic barriers, as reflected in their poverty and income statistics.
10. Norwalk

Income Ratio (Women for Male Dollar Earned): $0.77
Women in Management: 38.7%
Women in Poverty: 11.5%
Women Uninsured: 15.8%
Norwalk, while better off than some other cities, still presents challenges for women, particularly in terms of healthcare access.
Summary on the Worst Cities for Women in Connecticut
The cities listed above represent the most challenging environments for women in Connecticut. Despite progress, women continue to confront numerous barriers, particularly in terms of employment opportunities and healthcare access. The disparities between the best and worst cities are stark, highlighting the need for ongoing advocacy and change.
Thompsonville, while not representative of every woman’s experience, exemplifies the unique challenges faced by women in certain communities. Explore our detailed list below to gain further insights into the experiences of women across Connecticut.
Detailed List of the Worst Cities for Women in Connecticut
| Rank | Place | Pay Gap |
|---|---|---|
| 1 | Thompsonville | $0.57 |
| 2 | Groton | $0.61 |
| 3 | Danbury | $0.71 |
| 4 | Greenwich | $0.60 |
| 5 | Willimantic | $0.60 |
| 6 | Pawcatuck | $0.51 |
| 7 | Norwich | $0.70 |
| 8 | Winsted | $0.81 |
| 9 | New London | $0.65 |
| 10 | Norwalk | $0.77 |
| 11 | Torrington | $0.75 |
| 12 | Riverside | $0.31 |
| 13 | Naugatuck | $0.68 |
| 14 | Cos Cob | $0.48 |
| 15 | Bridgeport | $0.76 |
| 16 | Westport | $0.27 |
| 17 | Stamford | $0.74 |
| 18 | East Haven | $0.69 |
| 19 | Hartford | $0.81 |
| 20 | Stratford | $0.70 |
| 21 | West Haven | $0.72 |
| 22 | Waterbury | $0.82 |
| 23 | Darien | $0.26 |
| 24 | New Britain | $0.84 |
| 25 | Ridgefield | $0.44 |
| 26 | Old Greenwich | $0.27 |
| 27 | New Haven | $0.88 |
| 28 | Bethel | $0.58 |
| 29 | Bristol | $0.83 |
| 30 | East Hartford | $0.72 |
| 31 | Cheshire | $0.53 |
| 32 | Simsbury Center | $0.56 |
| 33 | Ansonia | $0.76 |
| 34 | Rockville | $0.98 |
| 35 | Derby | $0.85 |
| 36 | Glastonbury Center | $0.67 |
| 37 | Manchester | $0.88 |
| 38 | Wallingford Center | $0.76 |
| 39 | Shelton | $0.73 |
| 40 | Middletown | $0.73 |
| 41 | New Milford | $0.85 |
| 42 | Trumbull | $0.58 |
| 43 | Meriden | $0.76 |
| 44 | Portland | $0.85 |
| 45 | Wethersfield | $0.71 |
| 46 | North Haven | $0.74 |
| 47 | Southwood Acres | $0.71 |
| 48 | Milford (Balance) | $0.75 |
| 49 | West Hartford | $0.74 |
| 50 | Windsor Locks | $0.72 |
| 51 | Orange | $0.68 |
| 52 | Putnam | $0.97 |
| 53 | Branford Center | $0.84 |
| 54 | Oakville | $0.62 |
| 55 | Newington | $0.78 |
| 56 | Conning Towers Nautilus | $0.88 |
| 57 | Kensington | $0.79 |
| 58 | Sherwood Manor | $0.90 |
Author
Kathy is the head of content at Zippia with a knack for engaging audiences. Prior to joining Zippia, Kathy worked at Gateway Blend growing audiences across diverse brands. She graduated from Troy University with a degree in Social Science Education.


