The Worst States to Be a Man (And the Best)
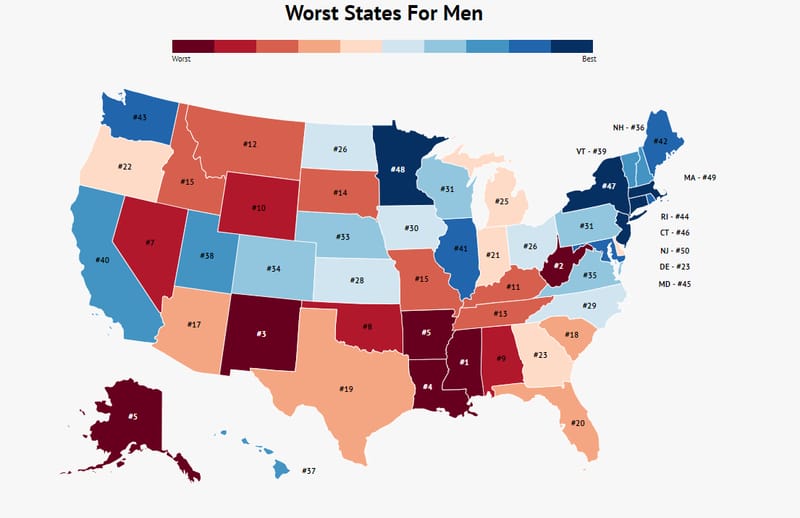
The worst state for men in the U.S. is Mississippi, with a state imprisonment rate of 619 and a male unemployment rate of 6.1%.
The best state for men in the U.S. is New Jersey, with a state imprisonment rate of 204 and a male unemployment rate of 4%.
Men in America are 3.88 times more likely to commit suicide than women.
92% of workplace fatalities involve men.
Being a man in the U.S. can come with various advantages, particularly in the workforce. Statistics indicate that men are still more likely to hold leadership positions and earn higher median incomes compared to their female counterparts. However, the reality is more complex, as men also face significant challenges.
Despite these advantages, men are disproportionately affected by negative outcomes such as higher imprisonment rates, increased suicide risk, and lower educational attainment. As socioeconomic issues evolve, it’s crucial to consider how different states impact men’s well-being and opportunities.
With the vast diversity in conditions across the United States, we aimed to identify which states present the most significant struggles for men. The results show that location plays a crucial role in defining the quality of life for men in America.
Here, we present a detailed analysis of the states where men face the greatest hardships.
The Worst States for Men
These states rank as the worst for men, primarily concentrated in the southern and western regions, indicating that these areas may present more challenges for men.
If your state isn’t among the bottom ten, continue reading to find out where it stands. For those interested in understanding how we ranked these states, let’s delve into our methodology.
How We Determined the Worst States for Men
Each state was rated on a scale of 1 to 50 across five critical categories:
-
Suicide Rate Per 100,000 (Higher is worse)
-
State Imprisonment Rates (Higher is worse)
-
Male Unemployment Rate (Higher is worse)
-
Percentage of Males Aged 25-34 with a Bachelor’s Degree (Lower is worse)
-
Workplace Fatalities
Data on suicide rates was sourced from the Kaiser Family Foundation. Although not gender-specific, men are over three times more likely to commit suicide compared to women, underscoring its importance in assessing male well-being.
Imprisonment rates were obtained from The Sentencing Project. Similar to suicide, these statistics are not gender-disaggregated, but men are nearly ten times more likely to be incarcerated than women, which has detrimental effects on future employment and social stability.
Educational attainment and male unemployment statistics were derived from the Census’s American Community Survey.
Workplace fatality rates were taken from the BLS’s Census of Occupational Fatalities, reflecting the reality that men dominate high-risk jobs and thus face greater workplace hazards.
1. Mississippi

Suicide Rate: 15
State Imprisonment: 619
Male Unemployment: 6.1
% with Bachelor’s Degree: 19.3
Work Fatalities: 6.3
Mississippi ranks as the worst state for men due to consistently low performance across various metrics. With the lowest educational attainment rates and high unemployment, men in Mississippi face significant hurdles. Moreover, many work in dangerous conditions, compounded by high incarceration rates, making life particularly challenging for men in this state.
2. West Virginia

Suicide Rate: 21.2
State Imprisonment: 392
Male Unemployment: 5.9
% with Bachelor’s Degree: 24.3
Work Fatalities: 6.6
West Virginia is the second-worst state for men, facing high unemployment rates, alarming suicide statistics, and overall challenging conditions.
3. New Mexico

Suicide Rate: 23.3
State Imprisonment: 344
Male Unemployment: 6.1
% with Bachelor’s Degree: 20
Work Fatalities: 4.9
While men in New Mexico may have lower incarceration rates than in other states, they still contend with significant educational deficits and high suicide rates.
4. Louisiana

Suicide Rate: 15.2
State Imprisonment: 719
Male Unemployment: 6
% with Bachelor’s Degree: 22.7
Work Fatalities: 5
Louisiana has the highest incarceration rates in the country, creating barriers to employment for men both inside and outside the prison system.
5. Arkansas

Suicide Rate: 20.7
State Imprisonment: 598
Male Unemployment: 4
% with Bachelor’s Degree: 22.3
Work Fatalities: 5.3
Arkansas ranks fifth worst for men, with only 22% of men aged 25-34 holding a bachelor’s degree, coupled with high incarceration rates.
6. Alaska

Suicide Rate: 27.1
State Imprisonment: 258
Male Unemployment: 7.5
% with Bachelor’s Degree: 22.5
Work Fatalities: 5.2
Alaskan men face the highest suicide rates nationwide, along with significant unemployment and hazardous working conditions.
7. Nevada

Suicide Rate: 20.3
State Imprisonment: 451
Male Unemployment: 5.2
% with Bachelor’s Degree: 21.4
Work Fatalities: 4.2
Nevada ranks seventh, with male unemployment and suicide rates that, while better than the worst states, still reveal serious issues.
8. Oklahoma

Suicide Rate: 19.1
State Imprisonment: 704
Male Unemployment: 4
% with Bachelor’s Degree: 23.4
Work Fatalities: 5.6
In Oklahoma, high imprisonment rates coupled with low educational attainment create challenges for men seeking employment.
9. Alabama

Suicide Rate: 16.6
State Imprisonment: 486
Male Unemployment: 5.1
% with Bachelor’s Degree: 23.9
Work Fatalities: 5.2
Alabama, while not the worst, still faces considerable challenges with high rates of imprisonment and low educational attainment among men.
10. Wyoming

Suicide Rate: 26.7
State Imprisonment: 429
Male Unemployment: 3.5
% with Bachelor’s Degree: 22.1
Work Fatalities: 12.3
Wyoming ranks tenth. Despite low unemployment, the high suicide rates and hazardous working conditions are significant concerns for men in the state.
Summary on the Worst States for Men
While men often occupy leadership roles, they still face significant societal challenges, including high rates of imprisonment, increased suicide risk, and lower educational levels. The ten states listed above offer the most adverse conditions for men. Notably, the disparity between the best and worst states is stark; for instance, the difference in male unemployment rates between North Dakota and Alaska is 5%, while men in Massachusetts are twice as likely to hold a bachelor’s degree compared to men in Mississippi.
The top states for men include:
New Jersey
Massachusetts
Minnesota
New York
Connecticut
In these states, men tend to be better educated and face lower imprisonment rates. Coupled with robust economies, safer workplaces, and improved emotional well-being, it’s clear that the East Coast, along with Minnesota, offers more favorable conditions for men. While Mississippi may not represent the worst experience for every individual, it presents considerable obstacles for many men living there.
Curious about where your state ranks? Check out the complete list below:
Worst States for Men:
| Rank (Worst-To-Best) | Location | Suicide Rate Per 100,000 Individuals | State Imprisonment | Male Unemployment (%) | Bachelor’s Degree or Higher (%) | Workplace Fatalities |
|---|---|---|---|---|---|---|
| 1 | Mississippi | 15 | 619 | 6 | 19 | 6 |
| 2 | West Virginia | 21 | 392 | 5 | 24 | 6 |
| 3 | New Mexico | 23 | 344 | 6 | 20 | 4 |
| 4 | Louisiana | 15 | 719 | 6 | 22 | 5 |
| 5 | Arkansas | 20 | 598 | 4 | 22 | 5 |
| 6 | Alaska | 27 | 258 | 7 | 22 | 5 |
| 7 | Nevada | 20 | 451 | 5 | 21 | 4 |
| 8 | Oklahoma | 19 | 704 | 4 | 23 | 5 |
| 9 | Alabama | 16 | 486 | 5 | 23 | 5 |
| 10 | Wyoming | 26 | 429 | 3 | 22 | 12 |
| 11 | Kentucky | 17 | 527 | 4 | 24 | 5 |
| 12 | Montana | 28 | 350 | 3 | 29 | 7 |
| 13 | Tennessee | 16 | 429 | 5 | 28 | 4 |
| 14 | South Dakota | 22 | 453 | 3 | 30 | 7 |
| 15 | Idaho | 23 | 447 | 3 | 24 | 4 |
| 16 | Missouri | 18 | 532 | 4 | 30 | 4 |
| 17 | Arizona | 18 | 569 | 4 | 26 | 2 |
| 18 | South Carolina | 16 | 386 | 4 | 27 | 4 |
| 19 | Texas | 13 | 553 | 4 | 27 | 4 |
| 20 | Florida | 13 | 466 | 4 | 26 | 3 |
| 21 | Indiana | 16 | 389 | 4 | 27 | 4 |
| 22 | Oregon | 19 | 364 | 4 | 30 | 3 |
| 23 | Delaware | 11 | 420 | 5 | 25 | 2 |
| 24 | Georgia | 13 | 506 | 4 | 28 | 3 |
| 25 | Michigan | 14 | 397 | 5 | 31 | 3 |
| 26 | North Dakota | 20 | 226 | 2 | 29 | 7 |
| 27 | Ohio | 14 | 441 | 4 | 30 | 3 |
| 28 | Kansas | 19 | 332 | 3 | 34 | 5 |
| 29 | North Carolina | 14 | 341 | 4 | 29 | 3 |
| 30 | Iowa | 15 | 285 | 3 | 30 | 4 |
| 31 | Wisconsin | 15 | 391 | 3 | 30 | 3 |
| 32 | Pennsylvania | 15 | 375 | 4 | 36 | 2 |
| 33 | Nebraska | 14 | 273 | 3 | 34 | 6 |
| 34 | Colorado | 20 | 351 | 3 | 38 | 3 |
| 35 | Virginia | 13 | 437 | 3 | 36 | 4 |
| 36 | New Hampshire | 18 | 204 | 3 | 33 | 3 |
| 37 | Hawaii | 15 | 240 | 3 | 25 | 2 |
| 38 | Utah | 22 | 206 | 2 | 31 | 3 |
| 39 | Vermont | 18 | 180 | 4 | 39 | 3 |
| 40 | California | 10 | 328 | 5 | 32 | 2 |
| 41 | Illinois | 11 | 324 | 5 | 38 | 2 |
| 42 | Maine | 18 | 134 | 3 | 30 | 2 |
| 43 | Washington | 16 | 262 | 3 | 36 | 2 |
| 44 | Rhode Island | 11 | 170 | 6 | 36 | 1 |
| 45 | Maryland | 9 | 317 | 4 | 38 | 3 |
| 46 | Connecticut | 10 | 268 | 5 | 38 | 1 |
| 47 | New York | 8 | 249 | 5 | 41 | 3 |
| 48 | Minnesota | 13 | 191 | 3 | 37 | 3 |
| 49 | Massachusetts | 9 | 120 | 4 | 48 | 3 |
| 50 | New Jersey | 8 | 204 | 4 | 41 | 2 |
Stay updated with the latest insights and engaging stories by subscribing to our newsletter. Email Kathy Morris at kmorris@zippia.com to join our weekly distribution.
Author
Kathy is the head of content at Zippia with a knack for engaging audiences. Prior to joining Zippia, Kathy worked at Gateway Blend growing audiences across diverse brands. She graduated from Troy University with a degree in Social Science Education.