Find a Job You Really Want In
Understanding State Taxes in 2026
Taxes are a fundamental aspect of our society, impacting everyone from individual citizens to large corporations. In 2026, understanding the tax landscape is more crucial than ever as states continue to adapt their tax structures to meet changing economic conditions and the demands of their residents.
Every state has its own unique tax framework, encompassing personal income, sales, and property taxes, which can significantly affect the financial well-being of its residents. As some states impose a heavier tax burden, others offer a more favorable environment for taxpayers. In this article, we delve into the most significant taxes imposed by each state, providing you with insights into where your tax dollars go.
Key Insights on State Taxes
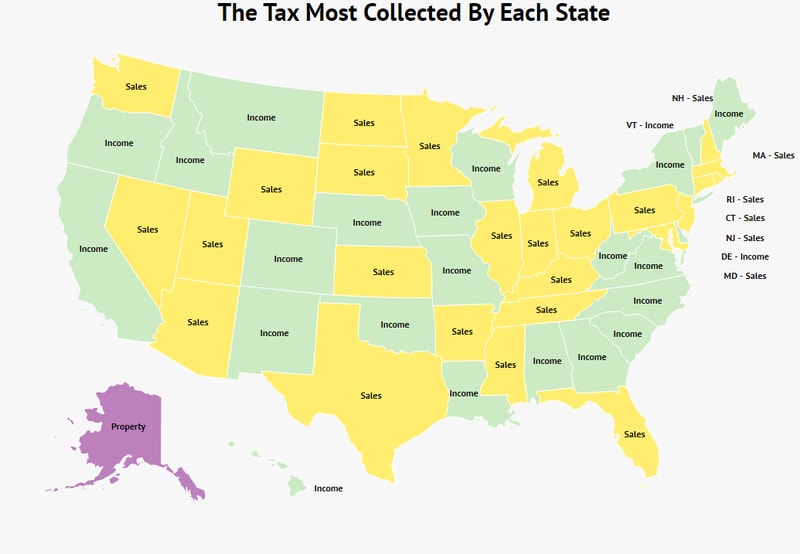
- Income taxes dominate in 23 states, with California taking the lead at a hefty 9.3%. Oregon follows closely with 9%, while Hawaii has an income tax rate of 8.25%. The state with the lowest income tax among these is Colorado, at 4.63%.
- For individuals looking to avoid income taxes, nine states, including New Hampshire, Texas, and Florida, do not levy income taxes on wages.
- Alaska stands out with property taxes surpassing all other forms of taxation, largely due to the absence of state income or sales taxes.
- New Hampshire offers a unique tax structure, having no income or sales tax, but compensates with one of the highest property tax rates at 1.86%.
- New Jersey consistently ranks as having the highest property tax rate at 1.89%, alongside significant sales and income tax rates, making it one of the more expensive states in terms of overall taxation.
- Mississippi, along with Tennessee, Indiana, and Rhode Island, has a relatively high sales tax rate of 7%, indicating a heavier reliance on consumption taxes.
While state and federal governments rely on taxes to fund essential services like infrastructure and education, taxpayers often feel the burden. Understanding your state’s taxation can help you make informed decisions about where to live and work.
Methodology for Tax Analysis
Our analysis of state taxation considered three primary areas:
- Property Tax
- Individual Income Tax
- Total Sales Tax
Data was sourced from reliable tax resources and state tax documents, identifying the highest percentage of taxation in each category. Notably, states like Alaska, which do not have income or sales taxes, showcase property tax as the predominant tax source.
Our focus was solely on state-level taxes and did not include local or metropolitan taxes, which can significantly impact overall tax burdens. Additionally, we excluded “sin” taxes, as these can be inconsistent in terms of individual expenditures.
Where Your Taxes Are Allocated
Understanding where your taxes go is vital for informed citizenship. In states with high tax burdens, such as California, the total tax rate can be overwhelming. To help you navigate this landscape, we have compiled a chart detailing the most significant taxes collected in each state.
| State | Tax | Property Tax | Income Tax | Sales Tax |
|---|---|---|---|---|
| Alabama | Income | 0.33% | 5.00% | 4.00% |
| Alaska | Property | 1.04% | 0 | 0.00% |
| Arizona | Sales | 0.72% | 4.17% | 5.60% |
| Arkansas | Sales | 0.52% | 5.90% | 6.50% |
| California | Income | 0.74% | 9.30% | 7.25% |
| Colorado | Income | 0.60% | 4.63% | 2.90% |
| Connecticut | Sales | 1.63% | 5.50% | 6.35% |
| Delaware | Income | 0.43% | 6.60% | 0.00% |
| Florida | Sales | 0.97% | 0 | 6.00% |
| Georgia | Income | 0.83% | 5.75% | 4.00% |
| Hawaii | Income | 0.26% | 8.25% | 4.00% |
| Idaho | Income | 0.69% | 6.93% | 6.00% |
| Illinois | Sales | 1.73% | 4.95% | 6.25% |
| Indiana | Sales | 0.85% | 3.23% | 7.00% |
| Iowa | Income | 1.29% | 7.44% | 6.00% |
| Kansas | Sales | 1.29% | 5.70% | 6.50% |
| Kentucky | Sales | 0.72% | 5.00% | 6.00% |
| Louisiana | Income | 0.18% | 6.00% | 4.45% |
| Maine | Income | 1.09% | 7.15% | 5.50% |
| Maryland | Sales | 0.87% | 4.75% | 6.00% |
| Massachusetts | Sales | 1.04% | 5.05% | 6.25% |
| Michigan | Sales | 1.62% | 4.25% | 6.00% |
| Minnesota | Sales | 1.05% | 6.80% | 6.88% |
| Mississippi | Sales | 0.52% | 5.00% | 7.00% |
| Missouri | Income | 0.91% | 5.40% | 4.23% |
| Montana | Income | 0.83% | 6.90% | 0.00% |
| Nebraska | Income | 1.76% | 6.84% | 5.50% |
| Nevada | Sales | 0.84% | 0 | 6.85% |
| New Hampshire | Sales | 1.86% | 0 | 0.00% |
| New Jersey | Sales | 1.89% | 5.53% | 6.63% |
| New Mexico | Income | 0.55% | 4.90% | 5.13% |
| New York | Income | 1.23% | 6.21% | 4.00% |
| North Carolina | Income | 0.78% | 5.25% | 4.75% |
| North Dakota | Sales | 1.42% | 2.04% | 5.00% |
| Ohio | Sales | 1.36% | 3.33% | 5.75% |
| Oklahoma | Income | 0.74% | 5.00% | 4.50% |
| Oregon | Income | 0.87% | 9.00% | 0.00% |
| Pennsylvania | Sales | 1.35% | 3.07% | 6.00% |
| Rhode Island | Sales | 1.35% | 3.75% | 7.00% |
| South Carolina | Income | 0.50% | 7.00% | 6.00% |
| South Dakota | Sales | 1.28% | 0 | 4.50% |
| Tennessee | Sales | 0.68% | 0 | 7.00% |
| Texas | Sales | 1.81% | 0 | 6.25% |
| Utah | Sales | 0.60% | 4.95% | 6.10% |
| Vermont | Income | 1.59% | 6.60% | 6.00% |
| Virginia | Income | 0.74% | 5.75% | 5.30% |
| Washington | Sales | 0.92% | 0 | 6.50% |
| West Virginia | Income | 0.49% | 6.50% | 6.00% |
| Wisconsin | Income | 1.76% | 6.27% | 5.00% |
| Wyoming | Sales | 0.58% | 0 | 4.00% |
In conclusion, understanding the tax landscape across different states is essential for making informed financial decisions. Whether you are considering relocation, job opportunities, or investments, knowing the tax implications can help you navigate your financial future more effectively. Stay informed, and ensure you’re making the best choices for your circumstances.
Author
Amanda Postma is a writer for the Zippia Career Advice blog with a focus on creating entertaining content to help you through your job search. She received her BA from the University Of Missouri-Columbia.