- Tech Industry Statistics
- MFA Statistics
- Streaming Services Statistics
- Mobile Vs. Desktop Usage Statistics
- AI Statistics
- Live Streaming Statistics
- Zoom Meeting Statistics
- Cord Cutting Statistics
- Digital Transformation Statistics
- Virtual Reality Statistics
- How Fast Is Technology Advancing
- Mobile Commerce Statistics
- SaaS Statistics
- Machine Learning Statistics
- Diversity In High Tech
- Cyber Security Statistics
- Ecommerce Statistics
- Tech Industry
- Gaming Industry
- Renewable Energy Job Creation
- Smartphone Industry
- Cybercrime Statistics
- Amazon Statistics
- Personalization Statistics
Research Summary. Ecommerce remains a pivotal driver of the U.S. economy, continually reshaping the landscape of retail sales. After thorough analysis, our data team has identified the following key insights:
-
As of 2026, there are approximately 2.5 million ecommerce businesses operating in the United States.
-
In 2026, the total number of 263 million online shoppers in the U.S. persists, reflecting a steady consumer base.
-
13.3% of total retail sales in the United States are conducted online.
-
In the third quarter of 2022, ecommerce sales in the U.S. reached $265.9 billion.
-
By 2025, U.S. ecommerce sales are projected to increase to $563.4 billion.
-
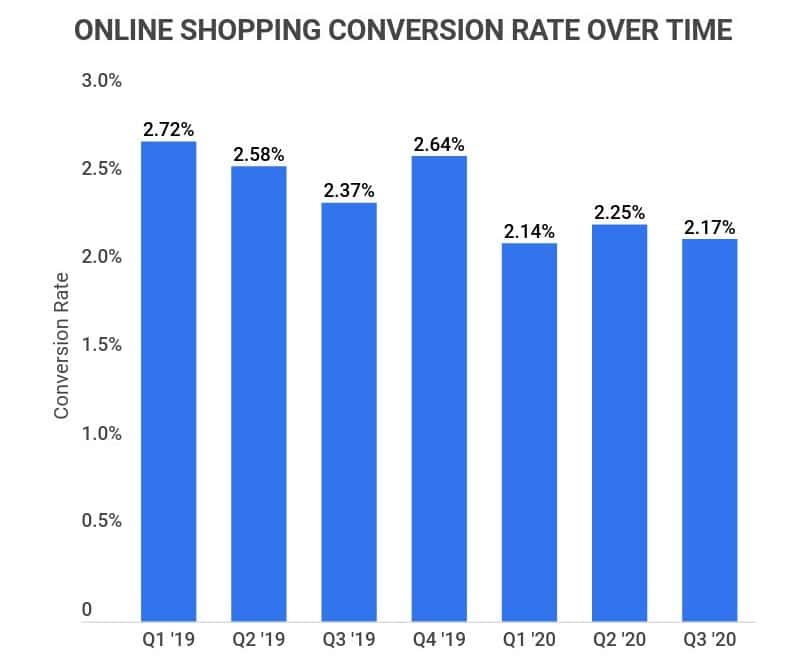
Approximately 2.57% of ecommerce site visits in the U.S. convert to a sale.
-
Globally, 69.57% of online shopping carts are abandoned before a purchase, a trend exacerbated during the pandemic.
For further analysis, we broke down the data in the following ways:
Customer Opinions | Customer Habits | Demographics | Trends and Projections
Ecommerce Business Statistics
-
There are an estimated 12 million to 24 million ecommerce websites globally.
This number continues to grow daily, with global estimates reaching as high as 24 billion. However, it’s important to note that less than one million of these sites generate more than $1,000 annually. Global leaders in the online shopping market include Amazon and Alibaba.
-
Approximately 26% of small businesses in the United States have an ecommerce website.
Despite the rapid growth of the online shopping market, 74% of small business owners have yet to establish an ecommerce presence. Among those without a website, 42% prioritize other business aspects over online sales, while 28% do not have any online presence.
-
In 2021, global ecommerce sales surpassed $4.2 trillion.
In that year, online shopping generated $4.28 trillion, with the U.S. accounting for $431.6 billion. Approximately two billion people worldwide made an online purchase.
-
Industry leaders attract millions of visitors monthly, while small businesses often see fewer than 500 visits.
Small business ecommerce sites average 414 monthly visitors, typically gaining traction through organic search. Comparatively, 13% of small businesses receive under 100 monthly visitors, while 55% attract fewer than 500.
In contrast, major platforms like Amazon boast billions of unique monthly visitors, averaging 2.45 billion, with eBay and Walmart following at 885 million and 410 million, respectively.
Customer Opinions on Ecommerce
-
Nearly 60% of American consumers prefer to shop online.
Data indicates that 59% of U.S. shoppers favor online shopping over physical stores, which account for 41% of preferences.
-
The majority of customers are more likely to make a purchase from a familiar site.
Approximately 90% of consumers are inclined to shop with retailers they have previously purchased from, provided they had a positive experience.
-
65% of customers prioritize experience over price when shopping online.
According to research from Raydiant, 65% of consumers are likely to spend more if they have a favorable shopping experience, emphasizing the importance of customer service.
-
About 30% of online customers appreciate chatbots.
While a significant portion of shoppers still prefer human representatives, 30% express a preference for chatbots. Notably, 71% would hesitate to shop from a retailer lacking customer service agents.
-
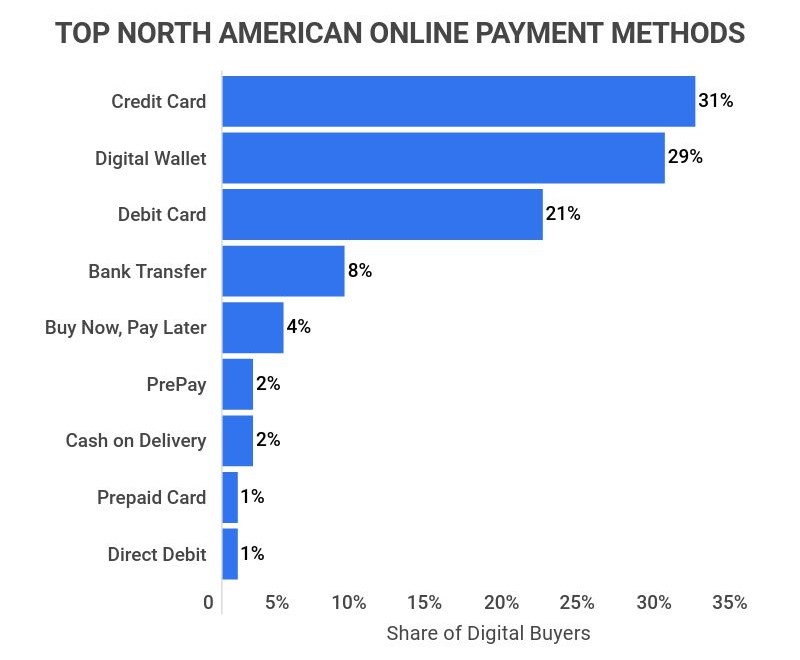
Just under half of all ecommerce sales globally utilize digital or mobile wallets.
Mobile wallets dominate online payment methods, accounting for 44.5% of ecommerce sales, followed by credit cards at 22.8% and bank or debit cards at 12.3%.
Customer Ecommerce Habits
-
U.S. consumers spend over $400 billion online yearly.
Annual data indicates that American shoppers spend approximately $431.6 billion online, averaging about $3.39 per shopping session.
-
81% of customers conduct product research prior to online purchases.
Over 80% of consumers research products before buying online, with many spending an average of 79 days gathering information for major purchases exceeding $500.
-
Global ecommerce conversion rates are highest on tablets.
Recent trends show that tablet visits convert at approximately 3.41%, surpassing desktop conversions at 2.59% and mobile conversions at 1.86%.
-
Price comparison is prevalent among online shoppers.
80% of customers compare prices across multiple ecommerce sites, with 57% abandoning their carts to explore options at other retailers.
-
International purchases have increased among U.S. shoppers.
Many consumers have turned to international ecommerce, with 32% reporting heightened online purchases from overseas and 51% planning to continue this trend in the future.
Ecommerce Customer Demographics
-
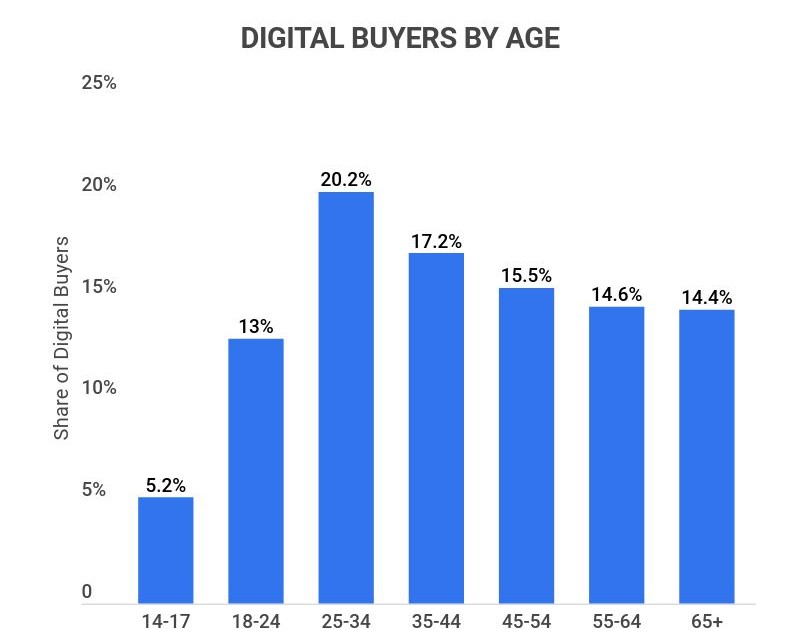
Millennials constitute the largest demographic of online shoppers, closely followed by those aged 35 to 44.
Millennials, typically aged 25 to 34, account for 20.2% of online shoppers, with individuals aged 35 to 44 making up 17.2%. Those aged 45 to 54 contribute 15.5% to the online consumer base, while shoppers aged 14 to 17 represent the smallest segment at 5.2%.
Ecommerce Trends and Projections
-
The share of ecommerce sales in total retail has grown by about 8.3% since 2012.
Since 2012, ecommerce’s share of overall retail sales has shifted from approximately 5% to 13.3%, marking significant growth in online shopping.
-
Digital sales have surged by 14% since 2017.
In 2026, around 263 million Americans are shopping online, up from 230.6 million in 2017, reflecting a clear upward trend.
-
Ecommerce grew by approximately 3.7% in 2020.
Statista reported that the number of online shoppers in 2020 was 256 million, compared to 246.9 million in 2019, marking a 3.7% increase.
-
Online shopping is projected to grow by 13.7% in the next four years.
Estimates indicate an additional 35.2 million Americans will shop online by 2025, bringing the total to 291.2 million.
-
Ecommerce sales in the U.S. are expected to reach $563.4 billion by 2025.
Projected annual online sales in the U.S. for 2025 stand at $563.4 billion, signifying a substantial increase from previous years.
-
The global ecommerce market is set to grow at a CAGR of nearly 29% from 2021 to 2025.
This growth translates to an expected increase of about $10.87 trillion globally, with U.S. growth estimated at a CAGR of approximately 7.51%.
Some U.S. categories, such as online furniture and appliances, are anticipated to grow even faster, with a CAGR of 36.17%.

Ecommerce Statistics FAQ
-
How many ecommerce businesses are there?
There are between 12 and 24 million ecommerce businesses globally. North America represents a significant portion, with 4.2 million businesses across the continent and 2.5 million in the U.S.
-
What percentage of commerce is done online?
Today, roughly 13.3% of commerce is done online. The share of total retail sales conducted online in the United States has risen significantly from previous years.
-
What percentage of ecommerce is successful?
Only 2.57% of U.S. ecommerce site visits convert to a sale. Despite the growing popularity of online shopping, conversion rates remain low, with variations based on the device used.
-
How much has ecommerce grown in the past decade?
Ecommerce has experienced substantial growth over the past decade. From 2017 to 2026, digital sales have increased by approximately 14%, indicating a robust trend in online shopping.
-
What percentage of ecommerce is Amazon?
Roughly 37% of the U.S. ecommerce market is controlled by Amazon. This percentage is projected to increase, with Amazon expected to account for as much as 50% of the market.
-
How much is the ecommerce industry worth?
The ecommerce industry is valued at around $431.6 billion in revenue. Projections indicate that by 2025, the U.S. ecommerce industry will reach $563.4 billion in sales.
-
What is the future of ecommerce?
The future of ecommerce points to sustained growth. With global ecommerce expected to expand at a CAGR of nearly 29% from 2021 to 2025, the U.S. market is also projected to grow significantly, with total ecommerce sales expected to reach $563.4 billion by 2025.
-
How competitive is the ecommerce industry?
The ecommerce industry is highly competitive. With an estimated 12 to 24 million ecommerce websites globally, the market is saturated, making it challenging for smaller businesses to attract customers.
Conclusion
The ecommerce market continues to thrive both globally and in the U.S., marking it as one of the most lucrative and fastest-growing segments of retail. Approximately 263 million Americans are increasingly engaging in digital shopping through various devices.
While online sales currently account for 13.3% of total retail sales in the United States, this figure is on an upward trajectory. The global ecommerce market is anticipated to grow at a compound annual growth rate of nearly 29% between now and 2025, with U.S. ecommerce sales projected to reach $563.4 billion.
With such promising growth on the horizon, the future of online shopping appears exceptionally bright.
References
-
Statista. “Number Of Digital Buyers In The United States 2017-2025.” Accessed on November 9, 2021.
-
U.S. Census Bureau News. “Quarterly Retail Ecommerce Sales.” Accessed on November 10, 2021.
-
Statista. “Retail Ecommerce Revenue In The United States From 2017 To 2025.” Accessed on November 10, 2021.
-
Statista. “Global Online Shopper Conversion Rate 2018-2020.” Accessed on November 10, 2021.
-
Today. “Shoppers Are Abandoning Their Online Carts More Than Ever—Here’s Why.” Accessed on November 10, 2021.
-
Yahoo News. “The Global ECommerce Market Is Expected To Grow By $10.87 Trillion Durring 2021-2025, Progressing At A CAGR Of Almost 29% During The Forecast Period.” Accessed on November 10, 2021.
-
Statista. “U.S. Retail Ecommerce Sales CAGR 2018-2025, By Product Category.” Accessed on November 11, 2021.
-
Web Marketing Pros. “Study Shows 74% Of U.S. Small Businesses Don’t Have ECommerce.” Accessed on November 11, 2021.
-
Statista. “Ecommerce Worldwide—Statistics and Facts.” Accessed on November 11, 2021.
-
Statista. “Leading Ecommerce Sites In The U.S. 2021, By Monthly Visits.” Accessed on November 11, 2021
-
Search Engine Journal. “Over 50% Of Local Business Websites Receive Less Than 500 Visits Per Month.” Accessed on November 12, 2021.
-
Forbes. “Do Consumers Really Want To Shop Online?” Accessed on November 11, 2021.
-
Raydiant. “Report: The State Of Consumer Behavior 2021.” Accessed on November 11, 2021.
-
Oberlo. “Most Popular Online Payment Methods In 2020.” Accessed on November 11, 2021.
-
Forbes. “AI Stats News: 86% Of Consumers Prefer Humans To Chatbots.” Accessed on November 11, 2021.
-
General Electric. “GE Capital Retail Bank’s Second Annual Shopper Study Outlines Digital Path To Major Purchases—81% Research Online Before Visiting Store.” Accessed on November 11, 2021.
-
Visiture. “The Benefits Of Comparison Shopping For Ecommerce Merchants.” Accessed on November 11, 2021.
-
Digital Commerce 360. “Pandemic Prompts The World’s Online Shoppers To Buy More Cross-Border.” Accessed on November 11, 2021.
-
Statista. “U.S. Digital Buyer Distribution 2020, By Age Group.” Accessed on November 21, 2021.
-
Statista. “U.S. Amazon Retail Ecommerce GMV Share 2016-2021.” Accessed on November 12, 2021.
- Tech Industry Statistics
- MFA Statistics
- Streaming Services Statistics
- Mobile Vs. Desktop Usage Statistics
- AI Statistics
- Live Streaming Statistics
- Zoom Meeting Statistics
- Cord Cutting Statistics
- Digital Transformation Statistics
- Virtual Reality Statistics
- How Fast Is Technology Advancing
- Mobile Commerce Statistics
- SaaS Statistics
- Machine Learning Statistics
- Diversity In High Tech
- Cyber Security Statistics
- Ecommerce Statistics
- Tech Industry
- Gaming Industry
- Renewable Energy Job Creation
- Smartphone Industry
- Cybercrime Statistics
- Amazon Statistics
- Personalization Statistics
Author
Elsie is an experienced writer, reporter, and content creator. As a leader in her field, Elsie is best known for her work as a Reporter for The Southampton Press, but she can also be credited with contributions to Long Island Pulse Magazine and Hamptons Online. She holds a Bachelor of Arts degree in journalism from Stony Brook University and currently resides in Franklin, Tennessee.