Find a Job You Really Want In
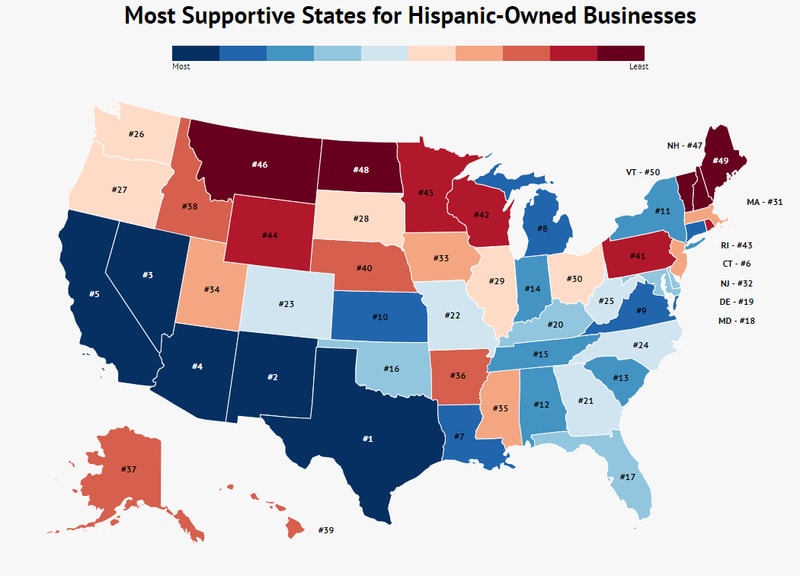
The best state in the U.S. for Hispanic-owned businesses is Texas, where 11.7% of businesses are Hispanic-owned, employing 617,270 workers.
The least supportive state in the U.S. for Hispanic-owned businesses is Vermont, with only 0.20% of businesses being Hispanic-owned.
Currently, there are 4.65 million Hispanic-owned businesses, accounting for 14% of the total 33 million businesses in the U.S.
Hispanic American entrepreneurs own 319,401 businesses and employ 2,829,058 workers.
As of 2026, Hispanic-owned businesses represent a significant 14% of the 33 million total businesses in the U.S. This translates to approximately 1 in 7 businesses being Hispanic-owned, showcasing the vital role these enterprises play in the economy.
From 2012 to 2026, the growth of Hispanic-owned businesses has continued to trend positively, indicating a resilient and expanding entrepreneurial spirit within this community.
To support aspiring business owners, we’ve identified the best states for Hispanic entrepreneurship based on key metrics of growth and employee support.
Top Ten States for Hispanic Business Owners in 2026
We determined these rankings by analyzing the number of Hispanic-owned businesses and the employment figures associated with them. These metrics reveal where Hispanic entrepreneurs can find the most supportive environments for their ventures.
How We Determined the Most Supportive States for Hispanic Businesses
We evaluated three key factors to identify the best states for Hispanic business owners:
- The percentage of Hispanic-owned businesses
- Comparison of Hispanic-owned businesses to the state’s Hispanic population
- Average number of employees in Hispanic-owned businesses
We began by examining the percentage of Hispanic-owned businesses within each state, utilizing data from the Census’ Annual Business Survey. This metric helps identify states with the most conducive environments for Hispanic entrepreneurship.
Next, we considered the Hispanic population in each state to assess the balance between Hispanic residents and Hispanic-owned businesses. A closer alignment between these figures indicates a more supportive market.
Lastly, we analyzed the employment figures in Hispanic-owned businesses to gauge their size and overall success. While many small businesses thrive with fewer employees, higher employment numbers can signify a robust business ecosystem.
1. Texas

Percent of Hispanic-Owned Businesses: 11.7%
Number of Employees: 617,270
Average Employees: 12
Texas ranks first for its strong support of Hispanic-owned businesses, boasting an impressive 11.7% ownership rate. These businesses collectively employ 617,270 workers, making Texas a prime location for Hispanic entrepreneurship.
2. New Mexico

Percent of Hispanic-Owned Businesses: 15.3%
Number of Employees: 55,621
Average Employees: 11
New Mexico stands out with the highest percentage of Hispanic-owned businesses at 15.3%. This state is an excellent choice for Hispanic entrepreneurs aiming for success.
3. Nevada

Percent of Hispanic-Owned Businesses: 6.2%
Number of Employees: 34,070
Average Employees: 10
Nevada ranks third with a Hispanic ownership percentage of 6.2%, providing 34,070 jobs across the state. This environment is conducive for Hispanic business owners.
4. Arizona

Percent of Hispanic-Owned Businesses: 7.0%
Number of Employees: 76,854
Average Employees: 10
Arizona is another top contender, with 7% of its businesses being Hispanic-owned, creating a supportive community for Hispanic entrepreneurs.
5. California

Percent of Hispanic-Owned Businesses: 9.3%
Number of Employees: 673,530
Average Employees: 9
California holds the position of the fifth-most supportive state, with 9.3% of its businesses owned by Hispanics, contributing to a substantial workforce of 673,530 employees.
6. Connecticut

Percent of Hispanic-Owned Businesses: 2.8%
Number of Employees: 19,262
Average Employees: 10
Connecticut ranks sixth, with nearly 3% of businesses owned by Hispanics. The average Hispanic-owned business here employs 10 workers, highlighting the potential for success.
7. Louisiana

Percent of Hispanic-Owned Businesses: 1.7%
Number of Employees: 16,621
Average Employees: 12
Louisiana’s support for Hispanic-owned businesses is reflected in the average number of employees, with each business employing around 12 workers.
8. Michigan
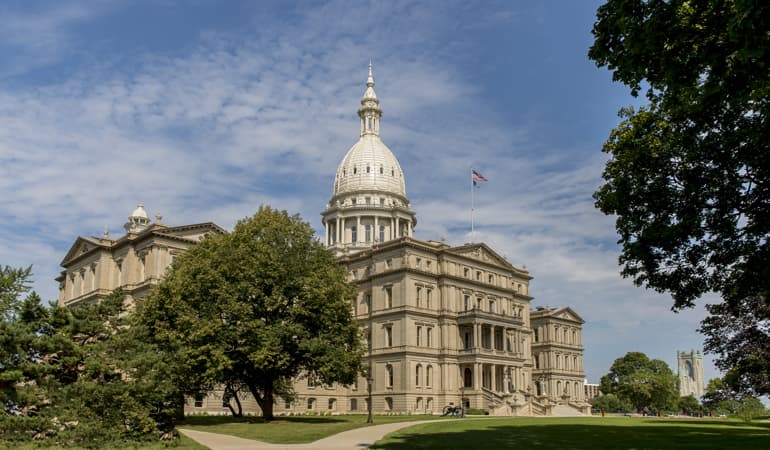
Percent of Hispanic-Owned Businesses: 1.3%
Number of Employees: 32,593
Average Employees: 14
Michigan ranks third in average employees per Hispanic-owned business, with each business employing an average of 14 workers, indicating a strong business environment.
9. Virginia

Percent of Hispanic-Owned Businesses: 3.4%
Number of Employees: 47,060
Average Employees: 9
Virginia supports 3.4% of its businesses being Hispanic-owned, providing jobs for 47,060 employees.
10. Kansas

Percent of Hispanic-Owned Businesses: 2.5%
Number of Employees: 14,971
Average Employees: 10
Kansas rounds out our list as the 10th most supportive state for Hispanic-owned businesses, with 2.5% of its businesses owned by Hispanics and providing nearly 15,000 jobs.
Showing Support
When starting a business, it is crucial to find an environment that fosters growth and success. The states highlighted above provide the best environments for Hispanic entrepreneurs, demonstrating strong support for Hispanic-owned businesses.
If you’re considering starting a business, these states should be at the top of your list. For those curious about which states offer the least support for Hispanic entrepreneurship, refer to the table below.
| Rank | State | Percent Of Hispanic-Owned Businesses | Number Of Employees | Average Employees |
|---|---|---|---|---|
| 1 | Texas | 11.73% | 617,270 | 12 |
| 2 | New Mexico | 15.31% | 55,621 | 11 |
| 3 | Nevada | 6.25% | 34,070 | 10 |
| 4 | Arizona | 6.97% | 76,854 | 10 |
| 5 | California | 9.34% | 673,530 | 9 |
| 6 | Connecticut | 2.84% | 19,262 | 10 |
| 7 | Louisiana | 1.69% | 16,621 | 12 |
| 8 | Michigan | 1.30% | 32,593 | 14 |
| 9 | Virginia | 3.43% | 47,060 | 9 |
| 10 | Kansas | 2.51% | 14,971 | 10 |
| 11 | New York | 4.68% | 183,577 | 8 |
| 12 | Alabama | 1.29% | 12,997 | 14 |
| 13 | South Carolina | 1.58% | 15,662 | 12 |
| 14 | Indiana | 1.75% | 20,639 | 11 |
| 15 | Tennessee | 1.60% | 18,525 | 12 |
| 16 | Oklahoma | 2.55% | 17,231 | 9 |
| 17 | Florida | 14.63% | 441,683 | 7 |
| 18 | Maryland | 3.47% | 30,532 | 8 |
| 19 | Delaware | 2.01% | 3,887 | 9 |
| 20 | Kentucky | 0.93% | 7,702 | 12 |
| 21 | Georgia | 2.95% | 43,188 | 8 |
| 22 | Missouri | 1.21% | 14,838 | 11 |
| 23 | Colorado | 4.14% | 41,748 | 7 |
| 24 | North Carolina | 2.72% | 41,892 | 9 |
| 25 | West Virginia | 0.63% | 2,891 | 17 |
| 26 | Washington | 3.75% | 40,727 | 7 |
| 27 | Oregon | 3.29% | 22,981 | 7 |
| 28 | South Dakota | 0.29% | 1,209 | 18 |
| 29 | Illinois | 5.30% | 85,634 | 6 |
| 30 | Ohio | 0.79% | 16,649 | 11 |
| 31 | Massachusetts | 1.81% | 22,693 | 9 |
| 32 | New Jersey | 5.67% | 65,482 | 6 |
| 33 | Iowa | 1.16% | 6,756 | 9 |
| 34 | Utah | 2.80% | 12,320 | 7 |
| 35 | Mississippi | 0.78% | 3,443 | 10 |
| 36 | Arkansas | 0.98% | 4,377 | 9 |
| 37 | Alaska | 2.56% | 2,884 | 7 |
| 38 | Idaho | 2.12% | 5,742 | 7 |
| 39 | Hawaii | 0.92% | 2,160 | 9 |
| 40 | Nebraska | 1.80% | 5,636 | 7 |
| 41 | Pennsylvania | 1.02% | 19,684 | 8 |
| 42 | Wisconsin | 0.82% | 7,726 | 9 |
| 43 | Rhode Island | 2.72% | 3,172 | 5 |
| 44 | Wyoming | 2.01% | 2,255 | 6 |
| 45 | Minnesota | 0.97% | 8,596 | 7 |
| 46 | Montana | 0.75% | 1,861 | 8 |
| 47 | New Hampshire | 0.56% | 1,334 | 8 |
| 48 | North Dakota | 0.20% | 261 | 7 |
| 49 | Maine | 0.21% | 429 | 6 |
| 50 | Vermont | 0.20% | 203 | 6 |
In conclusion, when considering where to establish a Hispanic-owned business, it is essential to analyze the supportiveness of each state. The rankings provided here reflect the current landscape for Hispanic entrepreneurs, offering insight into where they can thrive in 2026.
Author
Amanda Postma is a writer for the Zippia Career Advice blog with a focus on creating entertaining content to help you through your job search. She received her BA from the University Of Missouri-Columbia.