Find a Job You Really Want In
Top Cities for Millennials to Relocate in 2026
As the workforce evolves and the job market adapts to new technologies and remote working practices, millennials are navigating a unique landscape when it comes to relocation. This generation, characterized by innovation and adaptability, is redefining traditional life milestones such as homeownership and career progression.
Despite facing stereotypes, millennials are not only reshaping workplaces but also contributing significantly to local economies. With the right information, you can make a smart move that aligns with your career aspirations and lifestyle. We’ve compiled a list of the best cities across the U.S. that offer millennials a blend of affordability, job opportunities, and quality of life.
To identify the most millennial-friendly cities, we analyzed key factors including median incomes, home prices, unemployment rates, and poverty levels among millennials. Let’s dive into the top cities that should be on your relocation radar.
Top 10 Best Cities for Millennials
- Broadview Heights, Ohio
- Mountain Brook, Alabama
- Roselle, Illinois
- Bryant, Arkansas
- Saginaw, Texas
- Palm City, Florida
- Irondequoit, New York
- Farmington, Minnesota
- Prairie Village, Kansas
- Fishers, Indiana
With these cities in mind, it’s time to start planning your next chapter. Many millennials are entering homeownership later than previous generations, often in their 30s, due to financial challenges. The cities listed here offer competitive salaries and affordable housing, making it easier to save for a home and invest in your future.
Keep reading to discover our full analysis of the cities that are most suitable for millennials.
How We Determined the Best Cities for Millennials to Relocate
We analyzed 2,249 cities based on the following criteria:
- Median Income
- Percentage of millennials living in poverty
- Unemployment rates among millennials
- Median home prices
Our goal was to identify cities where salaries provide a comfortable living, poverty rates are low, and job opportunities abound. We also considered home prices to ensure affordability, as homeownership remains a priority for many millennials.
Data for our analysis was sourced from the latest Census ACS.
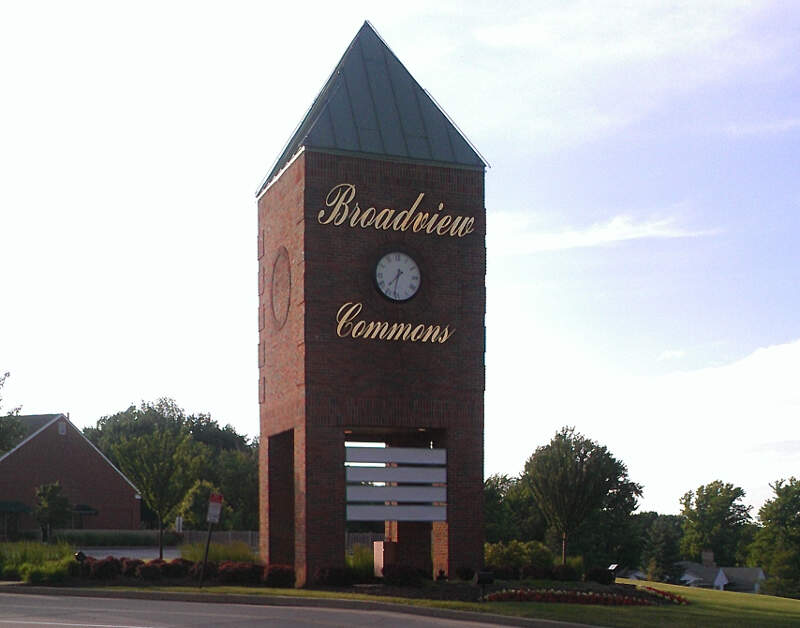
1. Broadview Heights, Ohio
Average Income: $45,808
Millennials in Poverty: 0.9%
Average Home Price: $243,100
Broadview Heights, Ohio, stands out as a top destination for millennials, with only 0.9% of the millennial population living in poverty. The average income is a healthy $45,808, and with homes averaging $243,100, it’s a great place to settle down early.
2. Mountain Brook, Alabama

Average Income: $75,105
Millennials in Poverty: 2.3%
Average Home Price: $605,300
Mountain Brook, Alabama, boasts a high average income of $75,105, although home prices are steeper at $605,300. However, the city’s solid economy offers a pathway to financial stability.
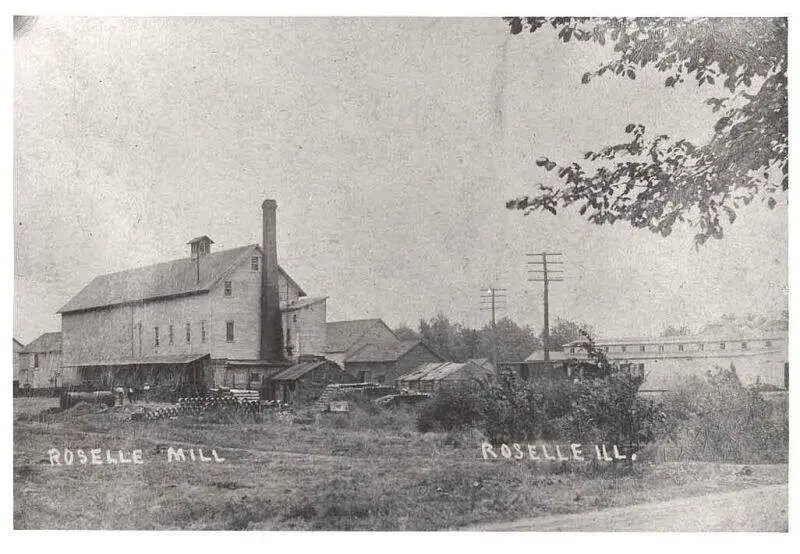
3. Roselle, Illinois
Average Income: $41,207
Millennials in Poverty: 4.1%
Average Home Price: $256,600
Located just outside of Chicago, Roselle, Illinois, offers an average income of $41,207 against a home price of $256,600, making it an attractive option for young professionals.
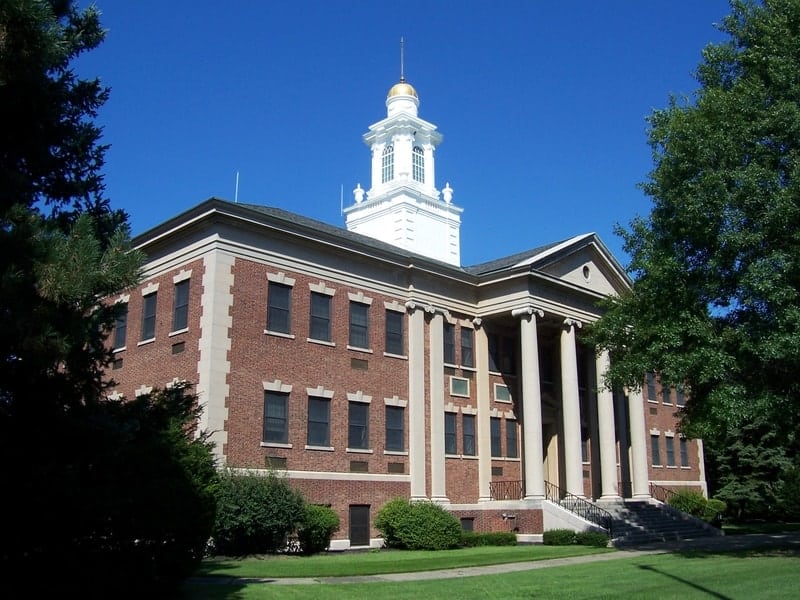
4. Bryant, Arkansas

Average Income: $37,614
Millennials in Poverty: 8.3%
Average Home Price: $163,900
In Bryant, Arkansas, despite a higher poverty rate of 8.3%, the city’s 0% unemployment rate offers hope. With an average home price of $163,900, it presents a compelling case for affordability.
5. Saginaw, Texas

Average Income: $43,342
Millennials in Poverty: 3.4%
Average Home Price: $151,200
In Saginaw, Texas, the average home price is just $151,200, making it one of the most affordable cities on this list, complemented by an average income of $43,342.
6. Palm City, Florida
Average Income: $42,340
Millennials in Poverty: 7.2%
Average Home Price: $341,400
Palm City, Florida, features a strong job market with a 0% unemployment rate, an average income of $42,340, and a vibrant community perfect for millennials.
7. Irondequoit, New York
Average Income: $39,239
Millennials in Poverty: 7.2%
Average Home Price: $120,900
Irondequoit is a hidden gem in New York for millennials, featuring affordable homes averaging just $120,900 and a supportive community for young professionals.
8. Farmington, Minnesota
Average Income: $46,291
Millennials in Poverty: 2.6%
Average Home Price: $244,100
Farmington, Minnesota, is another excellent choice for millennials, offering a low poverty rate of 2.6% and an average income of $46,291, alongside reasonable housing costs.
9. Prairie Village, Kansas
Average Income: $51,862
Millennials in Poverty: 3.4%
Average Home Price: $261,300
Prairie Village, Kansas, scores high with an average income of $51,862 and a low unemployment rate of 0.45%, making it an attractive place for millennials to thrive.
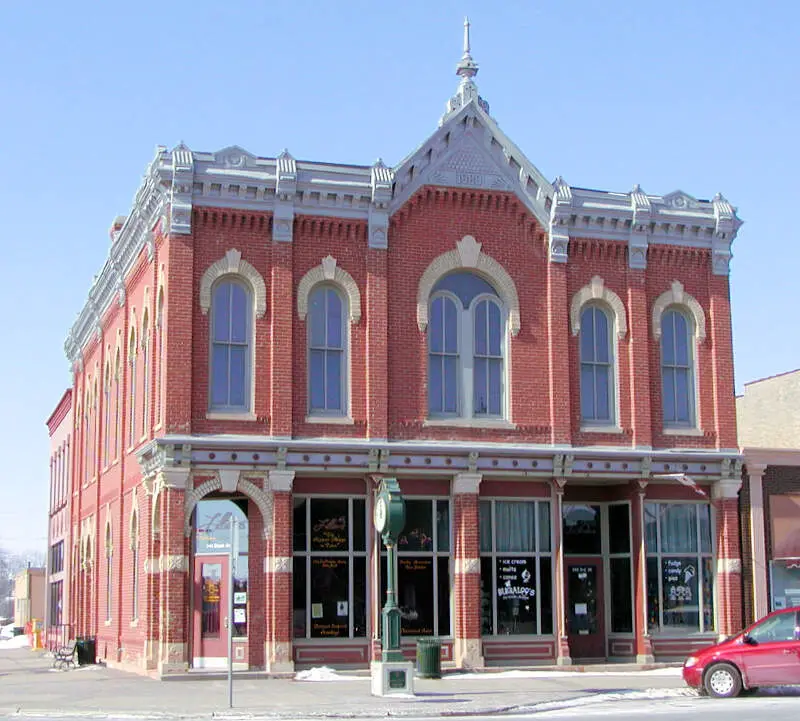
10. Fishers, Indiana
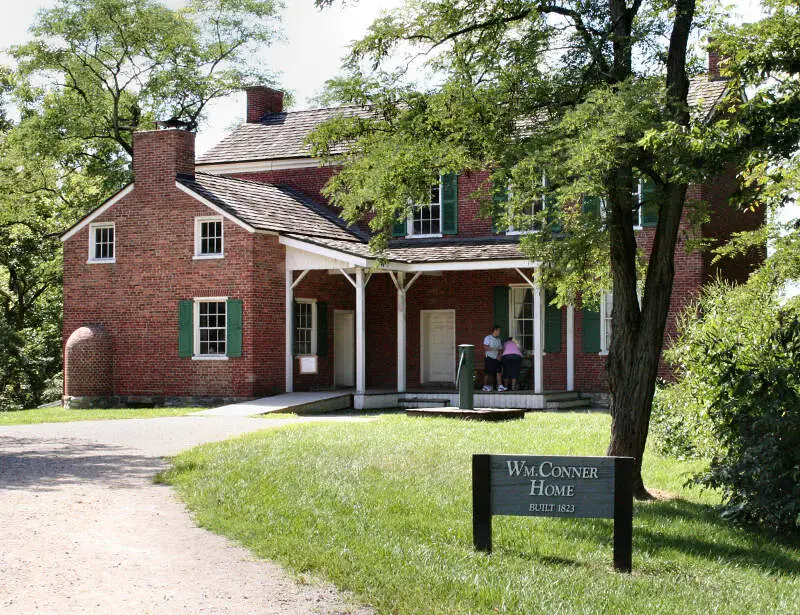
Average Income: $55,311
Millennials in Poverty: 4.5%
Average Home Price: $249,900
Fishers, Indiana, rounds out our list with an average income of $55,311 and an unemployment rate of just 1.5%. It’s an ideal spot to enjoy a higher standard of living.
Summary of the Best Cities for Millennials to Relocate
Millennials continue to face unique challenges in today’s economic landscape. Finding cities that offer both affordable living and promising job opportunities shouldn’t add to that stress. The cities highlighted in this article provide not only lower home prices but also higher average incomes, making them ideal for millennials looking to thrive.
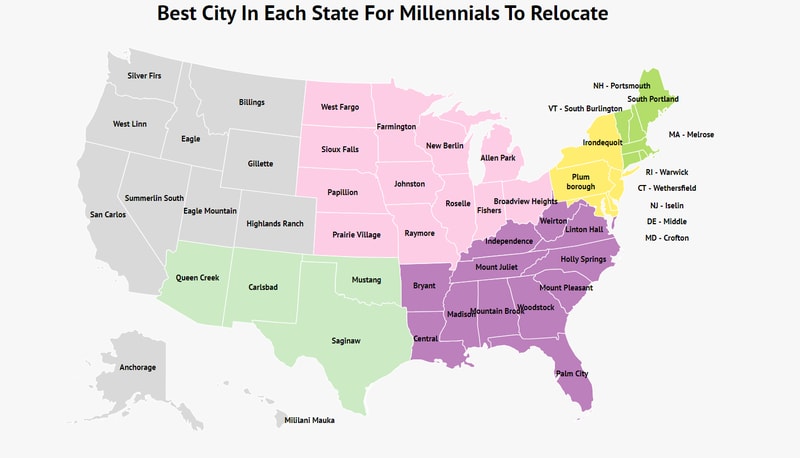
Explore the best city in each state where millennials can carve out a fulfilling life, balancing career ambitions with quality living conditions.
| State | City | Average Income | Unemployment | Poverty | Average Home Cost |
|---|---|---|---|---|---|
| Alabama | Mountain Brook | $75,105 | 0% | 2.30% | $605,300 |
| Alaska | Anchorage | $41,250 | 4.45% | 10% | $316,500 |
| Arizona | Queen Creek | $50,451 | 3.25% | 6.60% | $340,400 |
| Arkansas | Bryant | $37,614 | 0% | 8.30% | $163,900 |
| California | San Carlos | $91,084 | 1.45% | 3.70% | $1,541,900 |
| Colorado | Highlands Ranch | $59,004 | 2.85% | 4.60% | $443,000 |
| Connecticut | Wethersfield | $48,421 | 2.95% | 3.40% | $253,400 |
| Delaware | Middle | $47,657 | 9.95% | 6% | $280,900 |
| Florida | Palm City | $42,340 | 0% | 7.20% | $341,400 |
| Georgia | Woodstock | $42,258 | 1.55% | 7.50% | $224,100 |
| Hawaii | Mililani Mauka | $55,926 | 1.45% | 3.20% | $685,600 |
| Idaho | Eagle | $41,703 | 2% | 6.20% | $380,500 |
| Illinois | Roselle | $41,207 | 0% | 4.10% | $256,600 |
| Indiana | Fishers | $55,311 | 1.50% | 4.50% | $249,900 |
| Iowa | Johnston | $58,016 | 1.95% | 6.80% | $266,900 |
| Kansas | Prairie Village | $51,862 | 0.45% | 3.40% | $261,300 |
| Kentucky | Independence | $40,420 | 1.30% | 7.40% | $172,200 |
| Louisiana | Central | $41,424 | 3.65% | 5.70% | $209,600 |
| Maine | South Portland | $32,779 | 1.90% | 9.10% | $249,300 |
| Maryland | Crofton | $63,582 | 2.65% | 1% | $381,100 |
| Massachusetts | Melrose | $59,682 | 2.85% | 3.50% | $533,200 |
| Michigan | Allen Park | $39,596 | 2.70% | 11.10% | $121,500 |
| Minnesota | Farmington | $46,291 | 0.20% | 2.60% | $244,100 |
| Mississippi | Madison | $51,329 | 3.10% | 4.10% | $267,400 |
| Missouri | Raymore | $47,095 | 2.85% | 5.60% | $197,100 |
| Montana | Billings | $31,954 | 3.60% | 13.30% | $215,800 |
| Nebraska | Papillion | $37,664 | 1.80% | 2.80% | $181,400 |
| Nevada | Summerlin South | $57,614 | 4.05% | 6.70% | $388,200 |
| New Hampshire | Portsmouth | $44,391 | 2.40% | 5.90% | $408,500 |
| New Jersey | Iselin | $58,181 | 1.15% | 4.60% | $307,300 |
| New Mexico | Carlsbad | $57,290 | 4.60% | 8.70% | $796,900 |
| New York | Irondequoit | $39,239 | 2.60% | 7.20% | $120,900 |
| North Carolina | Holly Springs | $50,977 | 1.70% | 3.40% | $282,100 |
| North Dakota | West Fargo | $41,858 | 1.65% | 7.30% | $242,900 |
| Ohio | Broadview Heights | $45,808 | 0% | 0.90% | $243,100 |
| Oklahoma | Mustang | $38,381 | 2.35% | 6.40% | $157,900 |
| Oregon | West Linn | $52,485 | 1.45% | 7.50% | $471,100 |
| Pennsylvania | Plum | $41,265 | 5.05% | 3.20% | $154,600 |
| Rhode Island | Warwick | $41,583 | 5.35% | 7.40% | $214,200 |
| South Carolina | Mount Pleasant | $52,452 | 2.05% | 6.20% | $442,200 |
| South Dakota | Sioux Falls | $33,391 | 2.60% | 12.90% | $178,200 |
| Tennessee | Mount Juliet | $42,472 | 1.15% | 5.80% | $254,900 |
| Texas | Saginaw | $43,342 | 0.80% | 3.40% | $151,200 |
| Utah | Eagle Mountain | $39,597 | 0.65% | 4.30% | $251,600 |
| Vermont | South Burlington | $40,466 | 2.95% | 5.80% | $293,500 |
| Virginia | Linton Hall | $61,861 | 1.45% | 2.90% | $435,800 |
| Washington | Silver Firs | $59,830 | 1.10% | 3.60% | $453,000 |
| West Virginia | Weirton | $29,025 | 8.90% | 16.20% | $97,700 |
| Wisconsin | New Berlin | $47,046 | 1.10% | 3.30% | $252,500 |
| Wyoming | Gillette | $40,330 | 2% | 12.90% | $218,700 |
Author
Amanda Postma is a writer for the Zippia Career Advice blog with a focus on creating entertaining content to help you through your job search. She received her BA from the University Of Missouri-Columbia.


