Find a Job You Really Want In
Ever wondered where in the country people are happiest? Better yet, what cities in your state have the secret sauce for happiness?
Just like where you work and what you do, where you live can have major implications for your quality of life. We set out to find the cities in Massachusetts where life is sweetest, the wages are high, and people aren’t wasting their lives away in cars,
The results? Happiness comes in small packages.
The result is this list of the best cities for :
- Hingham, MA
- Needham, MA
- Wellesley, MA
- Lynnfield, MA
- Reading, MA
- Longmeadow, MA
- Lexington, MA
- Winchester, MA
- Newton, MA
- Cochituate, MA
These are the happiest places in Massachusetts. Keep reading to see what has everyone grinning so much.
How did we determined the happiest places to live in Massachusetts?
We turned happiness into a science and scoured the state to find the cities with all the ingredients for happiness:
- Being well educated (Population with at least a bachelor’s degree)
- Percent of households earning above $75,000
- Median home prices
- A short commute to work (Traffic = unhappiness)
- Having a family (Getting, and staying married, has a ton of happiness benefits, on average)
We examined over 117 cities, to find the cities that have all of the above in spades.
While some may be confused to see marriage rates included in our metrics, studies show that married people are typically happier than unmarried people. However, it is worth noting that marriage doesn’t cause happiness. In fact, people leaving a bad marriage experience spikes of happiness. However, a happy marriage and positive social interactions are important for mood and mental health.
Similarly, if you’re scratching your head to see $75,000 as the cut-off for happiness, blame Purdue University. Their study found that amount meets basic needs and frees people from the pitfalls of deep financial insecurity that cause unhappiness.
All of our data comes from the most recent American Community Survey.
Keep reading for more on why each of these 10 places is brimming with happiness—or hop to the bottom to see where your city landed on the list.
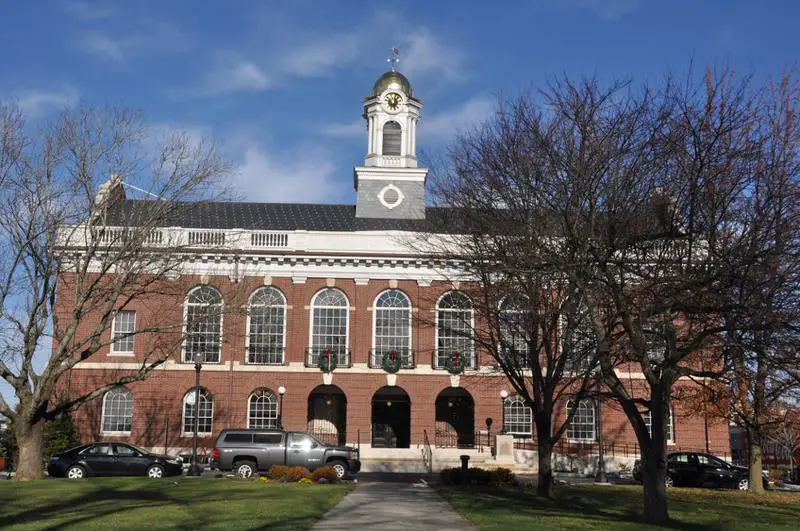
1. Hingham
Population: 6,290
Earners Over $75k: 69.7%
Average Commute: 37
Marriage Rate: 38.0%
Hingham is the happiest city in all of Massachusetts. What makes Hingham residents so happy? They aren’t wasting their lives on long commutes for one. The average Hingham resident only drives 37.7 minuted to work. Toss in affordable housing and the fact that most Hingham residents are coming home to a loving partner and it’s easy to see the city has a lot going for it.
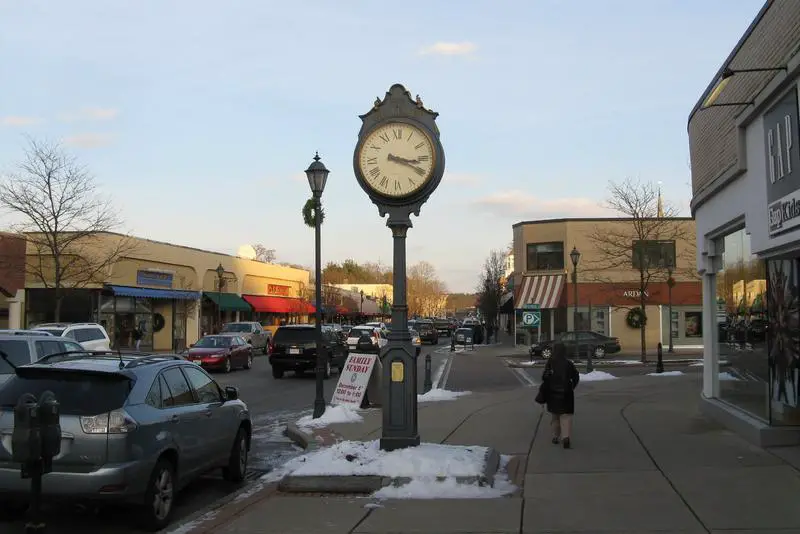
2. Needham
Population: 30,735
Earners Over $75k: 75.6%
Average Commute: 31
Marriage Rate: 28.0%
In 2nd place we have Needham. Residents of Needham are highly educated, with an impressive 76.0% having at least a bachelor’s degree. And in this modern day, education means options, and folks in Needham have plenty of them.
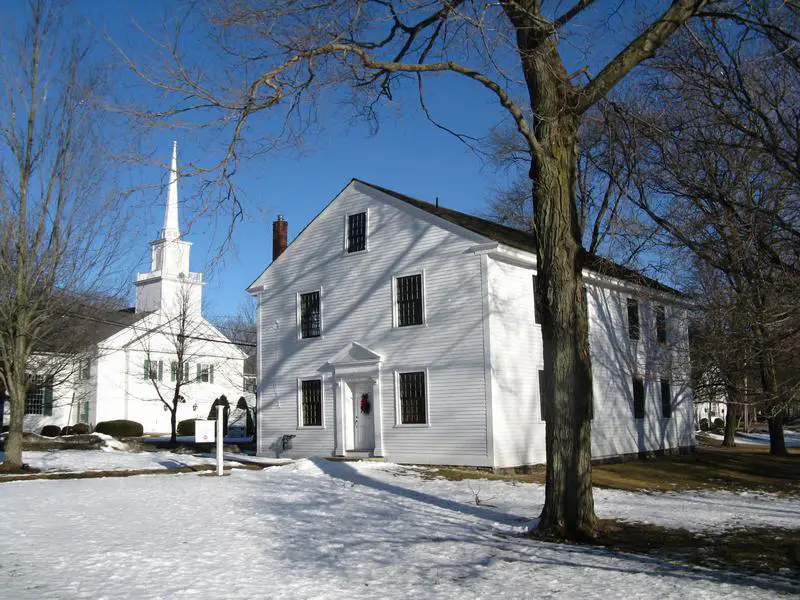
3. Wellesley
Population: 29,201
Earners Over $75k: 79.1%
Average Commute: 30
Marriage Rate: 18.0%
Wellesley is the third happiest city in Massachusetts. Why so happy? 18.0% of Wellesley residents come home to a partner to share their life burdens. Bonus? Short commutes give them more time to spend with all their loved ones or on hobbies they enjoy.
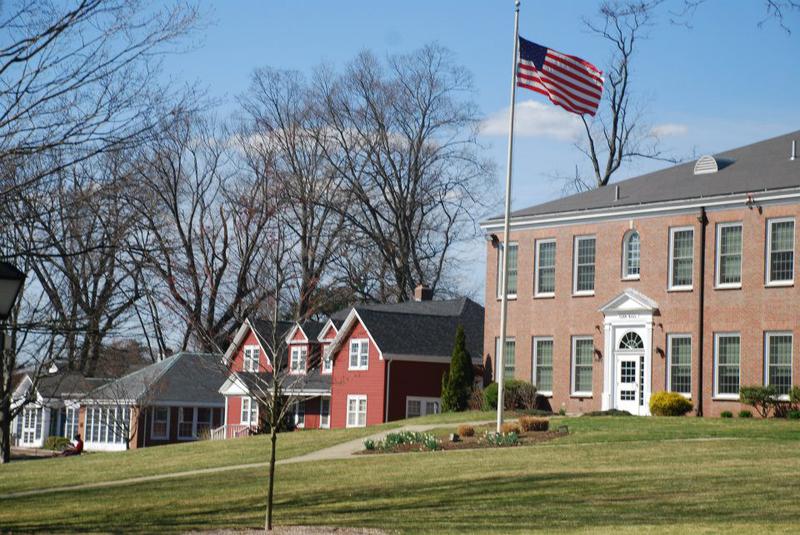
4. Lynnfield
Population: 12,847
Earners Over $75k: 70.6%
Average Commute: 33
Marriage Rate: 43.0%
Folks in Lynnfield have a lot to smile about. An impressive 70.6% of Lynnfield households earn $75,000 or more. That means families in Lynnfield can afford peace of mind.
5. Reading
Population: 25,100
Earners Over $75k: 68.2%
Average Commute: 33
Marriage Rate: 38.0%
Reading is the 5th happiest city in the whole state. Reading residents’ moods are kept high by reasonable home prices (the median home price in this Massachusetts city is only $534,100), happy marriages, and short commutes.
6. Longmeadow
Population: 15,830
Earners Over $75k: 70.0%
Average Commute: 23
Marriage Rate: 29.0%
Looking to relocate? Data says you should give Longmeadow a second look because it has all the ingredients for happiness. A staggering 70.0% of households earn over 75,000. Toss in high marriage rates and reasonable commutes, and it’s easy to see those who call Longmeadow home have a lot to be happy about.
7. Lexington
Population: 33,480
Earners Over $75k: 77.8%
Average Commute: 32
Marriage Rate: 19.0%
Lexington is the 7th happiest city. Lexington residents pull in respectable salaries and manage to do it, on average, within 32.4 minutes of their home. They can use all that extra time saved from a long commute to indulge in hobbies they’re passionate about.
8. Winchester
Population: 22,677
Earners Over $75k: 74.1%
Average Commute: 34
Marriage Rate: 26.0%
Winchester residents are highly educated with good incomes, decent marriage rates, and reasonable commutes. What’s not to be happy about?
9. Newton
Population: 88,660
Earners Over $75k: 72.4%
Average Commute: 28
Marriage Rate: 15.0%
The 9th happiest city in all of Massachusetts is Newton. The average commute in Newton is only 28.9 minutes. That means they are only 28.9 minutes away from the loving spouse 15.0% of them have.
10. Cochituate
Population: 6,942
Earners Over $75k: 76.6%
Average Commute: 33
Marriage Rate: 25.0%
In 10th place is Cochituate, Massachusetts. What makes Cochituate so great? Affordable housing, reasonable commutes, and healthy incomes. If happiness is contagious, moving here might be worth a try.
And that’s our list of the happiest cities in Massachusetts
There you have it, happiness is a place.
While we can’t guarantee everyone living and working in the top 10 cities is happy, they have a better chance the most.
If you are looking to improve your own happiness, check out how you can help improve your personal factors: housing costs, job satisfaction, income, and education.
If your city didn’t make the top 10, check out the list below to see whether it missed the cut by a hair or if folks there are struggling to escape despair.
Detailed List Of The Happiest Cities In
| Rank | City | High Earners |
|---|---|---|
| 1 | Hingham | 69.7% |
| 2 | Needham | 75.6% |
| 3 | Wellesley | 79.1% |
| 4 | Lynnfield | 70.6% |
| 5 | Reading | 68.2% |
| 6 | Longmeadow | 70.0% |
| 7 | Lexington | 77.8% |
| 8 | Winchester | 74.1% |
| 9 | Newton | 72.4% |
| 10 | Cochituate | 76.6% |
| 11 | Burlington | 65.9% |
| 12 | Wilmington | 71.8% |
| 13 | Medfield | 67.9% |
| 14 | Milton | 70.6% |
| 15 | Belmont | 66.8% |
| 16 | Franklin Town | 69.6% |
| 17 | Pinehurst | 68.0% |
| 18 | Nantucket | 59.8% |
| 19 | Swampscott | 66.6% |
| 20 | Northborough | 64.4% |
| 21 | Marblehead | 65.7% |
| 22 | Sharon | 74.3% |
| 23 | Wakefield | 58.9% |
| 24 | Melrose | 61.0% |
| 25 | Arlington | 65.6% |
| 26 | Maynard | 62.3% |
| 27 | Stoneham | 60.1% |
| 28 | Danvers | 55.4% |
| 29 | Brookline | 64.9% |
| 30 | Woburn | 58.5% |
| 31 | Braintree Town | 61.8% |
| 32 | Scituate | 66.6% |
| 33 | Dedham | 60.7% |
| 34 | Mansfield Center | 58.3% |
| 35 | Newburyport | 62.1% |
| 36 | Rockport | 52.6% |
| 37 | Watertown Town | 63.2% |
| 38 | Amesbury Town | 53.3% |
| 39 | Cambridge | 59.0% |
| 40 | Norwood | 59.2% |
| 41 | Kingston | 57.9% |
| 42 | Whitinsville | 50.2% |
| 43 | Gloucester | 44.8% |
| 44 | South Amherst | 40.6% |
| 45 | Somerset | 50.9% |
| 46 | West Concord | 62.6% |
| 47 | Methuen Town | 49.9% |
| 48 | Yarmouth Port | 47.5% |
| 49 | Beverly | 52.8% |
| 50 | Abington | 58.7% |
| 51 | Andover | 58.1% |
| 52 | Waltham | 55.4% |
| 53 | Peabody | 45.5% |
| 54 | Saugus | 54.7% |
| 55 | Milford | 52.0% |
| 56 | Barnstable Town | 44.7% |
| 57 | East Falmouth | 39.9% |
| 58 | Walpole | 51.2% |
| 59 | Hudson | 52.7% |
| 60 | Agawam Town | 44.7% |
| 61 | Middleborough Center | 41.8% |
| 62 | Oxford | 39.6% |
| 63 | Medford | 58.6% |
| 64 | Marlborough | 52.5% |
| 65 | Ocean Bluff-Brant Rock | 47.0% |
| 66 | Haverhill | 44.7% |
| 67 | Weymouth Town | 51.8% |
| 68 | Somerville | 59.3% |
| 69 | Northampton | 43.3% |
| 70 | North Amherst | 36.5% |
| 71 | Amherst Center | 37.2% |
| 72 | Hull | 55.6% |
| 73 | Easthampton Town | 39.2% |
| 74 | Westfield | 40.4% |
| 75 | Attleboro | 49.5% |
| 76 | Boston | 45.5% |
| 77 | Holbrook | 46.0% |
| 78 | Foxborough | 44.0% |
| 79 | Leominster | 38.7% |
| 80 | Taunton | 41.9% |
| 81 | Winthrop Town | 44.6% |
| 82 | Salem | 42.6% |
| 83 | Clinton | 33.4% |
| 84 | West Yarmouth | 39.9% |
| 85 | West Springfield Town | 33.6% |
| 86 | Bridgewater | 41.5% |
| 87 | Plymouth | 37.1% |
| 88 | Palmer Town | 40.8% |
| 89 | Bliss Corner | 43.8% |
| 90 | Pittsfield | 32.5% |
| 91 | Malden | 41.8% |
| 92 | Lowell | 35.4% |
| 93 | Holyoke | 27.3% |
| 94 | Quincy | 49.5% |
| 95 | Greenfield Town | 31.3% |
| 96 | South Yarmouth | 38.5% |
| 97 | Lawrence | 24.9% |
| 98 | Fitchburg | 35.9% |
| 99 | Everett | 38.9% |
| 100 | Chicopee | 32.5% |
Author
Kathy is the head of content at Zippia with a knack for engaging audiences. Prior to joining Zippia, Kathy worked at Gateway Blend growing audiences across diverse brands. She graduated from Troy University with a degree in Social Science Education.


