The 10 Worst States for Marriage (And the Best)
The best state for marriage is Georgia, where the average wedding costs only $19,142 and only 1.35% of married couples got divorced last year.
The worst state for marriage is Montana, where the average wedding costs $23,000 and only 2.3% of married couples got divorced last year.
Hawaii has the least amount of couples getting divorced, at only 0.93% last year.
Arkansas has the cheapest average wedding costs, at only $12,426.
Getting married can be one of the most significant decisions of your life—whether it turns out to be a blissful journey or a challenging experience.
From the ceremony planning to the marriage itself, many factors can contribute to success or failure. Sometimes a dream outdoor wedding may be marred by unexpected rain, while the financial pressure of an extravagant celebration can strain even the strongest relationships.
Additionally, the dynamics of marriage are influenced by various aspects, including finances, family support, and geographical location. To better understand these factors, we analyzed data to identify the states where marriage may be more precarious. The findings suggest that some states might be better off saying, “I don’t.”
How We Determined This
We evaluated each state based on three key factors:
-
Average wedding cost
-
Divorce rate
-
Annual rainfall in inches
First, we gathered average wedding cost data from ValuePenguin. Weddings can be expensive; even if you live happily ever after, it’s beneficial if the financial burden doesn’t linger.
Next, we examined each state’s divorce rates using the most recent ACS Census data to determine the percentage of ever-married couples who reported a divorce within the past year. While love may be in the air, the reality is that a marriage ending often indicates deeper issues at play.
Finally, we considered annual rainfall in inches. While rain is often seen as a sign of good luck on your wedding day, it can also lead to muddy aisles and soggy celebrations.
1. Georgia

Average Wedding Cost: $19,142
Percent of Married Couples Who Got Divorced Last Year: 1.35%
Rainfall: 50.72 inches
Georgia ranks as the worst state in the U.S. for weddings, with 1.35% of all married Georgians experiencing divorce last year. While this figure may not seem substantial, it translates to a noticeable risk over the long term. Additionally, couples should prepare for a potentially rainy wedding day.
2. Louisiana

Average Wedding Cost: $16,842
Percent of Married Couples Who Got Divorced Last Year: 1.28%
Rainfall: 60.09 inches
Louisiana is a close second. Although the average wedding costs a relatively low $16,842, couples should be cautious about planning outdoor events, as the state sees an average of 60.09 inches of rain annually, second only to Hawaii.
3. Maryland

Average Wedding Cost: $27,498
Percent of Married Couples Who Got Divorced Last Year: 1.18%
Rainfall: 44.64 inches
In Maryland, the average wedding cost is a hefty $27,498. The combination of a relatively high divorce rate and less-than-ideal weather conditions raises concerns for couples hoping for a fairytale wedding.
4. Connecticut

Average Wedding Cost: $29,499
Percent of Married Couples Who Got Divorced Last Year: 1.07%
Rainfall: 50.39 inches
Weddings in Connecticut are even pricier, averaging $29,499. While the divorce rate is slightly lower than Maryland’s, the weather is similar, earning Connecticut its fourth-place ranking.
5. Alabama

Average Wedding Cost: $15,056
Percent of Married Couples Who Got Divorced Last Year: 1.38%
Rainfall: 58.28 inches
Alabama, known as “Sweet Home Alabama,” may not be the best place to tie the knot. With one of the highest divorce rates in the nation, potential couples might want to reconsider.
6. Massachusetts

Average Wedding Cost: $30,489
Percent of Married Couples Who Got Divorced Last Year: 1.00%
Rainfall: 47.88 inches
In Massachusetts, couples spend an average of $30,489 on their wedding. With a divorce rate of 1%, the high wedding costs make it a significant financial commitment for couples who may not have the best odds.
7. Hawaii

Average Wedding Cost: $25,747
Percent of Married Couples Who Got Divorced Last Year: 0.93%
Rainfall: 63.7 inches
Hawaii is a stunning wedding destination, but couples should weigh the high costs and significant rainfall against the allure of a tropical wedding.
8. Arkansas
Average Wedding Cost: $12,426
Percent of Married Couples Who Got Divorced Last Year: 1.60%
Rainfall: 50.78 inches
Arkansas has the highest yearly divorce rate in the nation. This statistic raises questions about the state of marriages in Arkansas, making it a less desirable location for couples seeking long-lasting unions.
9. Virginia

Average Wedding Cost: $23,966
Percent of Married Couples Who Got Divorced Last Year: 1.18%
Rainfall: 44.39 inches
Virginia falls short in all three categories, with average wedding costs being moderately high, the weather being less than favorable, and a mediocre divorce rate.
10. Delaware

Average Wedding Cost: $23,416
Percent of Married Couples Who Got Divorced Last Year: 1.14%
Rainfall: 45.68 inches
Delaware rounds out the list with a narrative similar to Virginia’s, lacking in affordability, favorable weather, and a promising divorce rate.
Something Borrowed, Something Blue
Ultimately, the state where you choose to marry doesn’t guarantee marital bliss or lead to inevitable divorce. However, certain states do have higher divorce rates that may serve as a warning.
If you’re eyeing those high divorce rates and considering potential career paths, you might find opportunities in fields like couples counseling or divorce law.
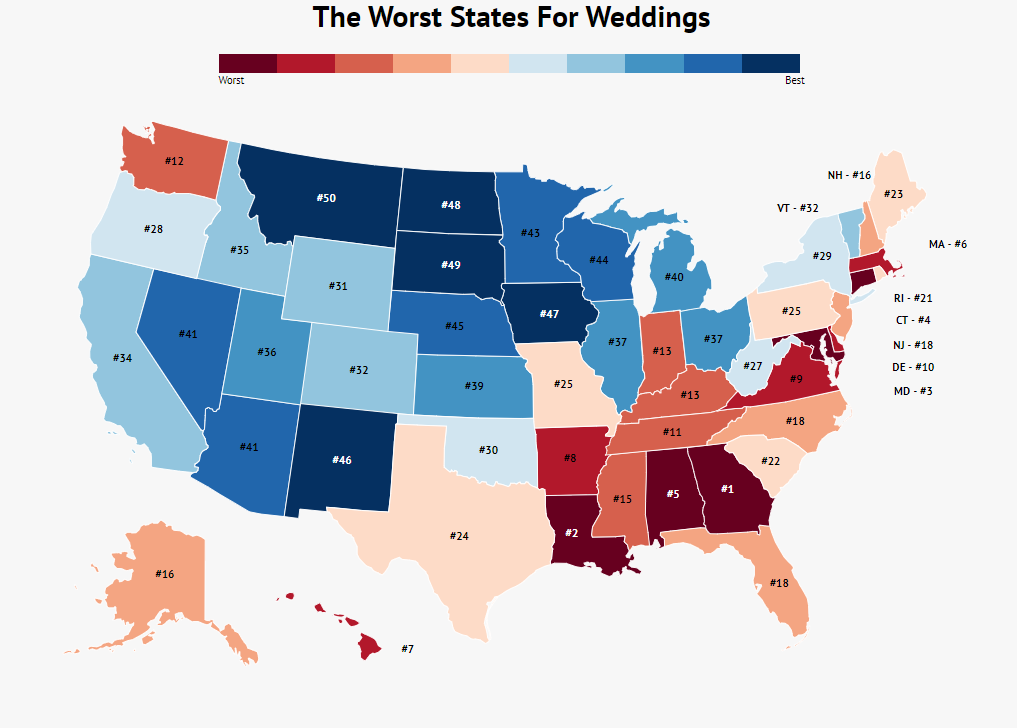
The Worst States for Weddings
| Rank | State |
|---|---|
| 1 | Georgia |
| 2 | Louisiana |
| 3 | Maryland |
| 4 | Connecticut |
| 5 | Alabama |
| 6 | Massachusetts |
| 7 | Hawaii |
| 8 | Arkansas |
| 9 | Virginia |
| 10 | Delaware |
| 11 | Tennessee |
| 12 | Washington |
| 13 | Kentucky |
| 13 | Indiana |
| 15 | Mississippi |
| 16 | New Hampshire |
| 16 | Alaska |
| 18 | Florida |
| 18 | North Carolina |
| 18 | New Jersey |
| 21 | Rhode Island |
| 22 | South Carolina |
| 23 | Maine |
| 24 | Texas |
| 25 | Pennsylvania |
| 25 | Missouri |
| 27 | West Virginia |
| 28 | Oregon |
| 29 | New York |
| 30 | Oklahoma |
| 31 | Wyoming |
| 32 | Vermont |
| 32 | Colorado |
| 34 | California |
| 35 | Idaho |
| 36 | Utah |
| 37 | Illinois |
| 37 | Ohio |
| 39 | Kansas |
| 40 | Michigan |
| 41 | Arizona |
| 41 | Nevada |
| 43 | Minnesota |
| 44 | Wisconsin |
| 45 | Nebraska |
| 46 | New Mexico |
| 47 | Iowa |
| 48 | North Dakota |
| 49 | South Dakota |
| 50 | Montana |
Author
Kathy is the head of content at Zippia with a knack for engaging audiences. Prior to joining Zippia, Kathy worked at Gateway Blend growing audiences across diverse brands. She graduated from Troy University with a degree in Social Science Education.