Find a Job You Really Want In
If you’re a blue-collar worker, then you’re no stranger to hard work. Day-in and day-out you wear yourself out for the betterment of the country. Whether you’re fighting fires or constructing a new hospital building, your skills in manual labor benefit the community.
Now, it’s no secret blue-collar workers work hard at their jobs. What they shouldn’t have to work hard for is finding the best cities to work in that benefit them. Leave it to us. We’ll do the heavy lifting for this part of your journey as we’ve found the best cities for blue-collar workers.
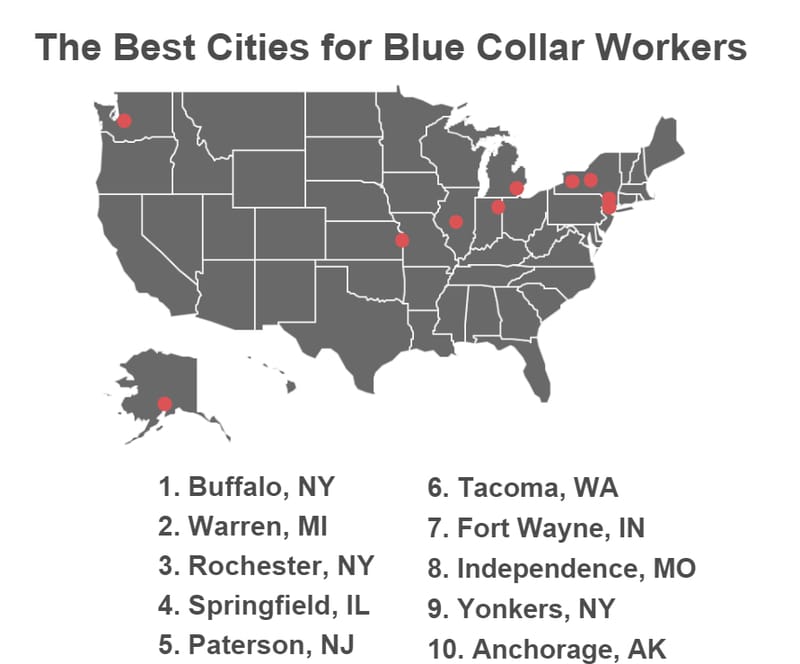
The 10 Best Cities for Blue Collar Workers
- Buffalo, New York
- Warren, Michigan
- Rochester, New York
- Springfield, Illinois
- Paterson, New Jersey
- Tacoma, Washington
- Fort Wayne, Indiana
- Independence, Missouri
- Yonkers, New York
- Anchorage, Alaska
If your city is on the top 10 then you’re in the right place. If not, keep reading for a complete list of best cities for blue-collar workers to see where your city ranks.
How We Determined The Best Cities For Blue-Collar Workers
We looked at over 200 cities and ranked them on the following areas:
- Median Income For Blue Collar Professions
- Average Home Value
- Union Membership Rates
We first examined median income in blue-collar professions in each city using data from Census ACS. This covers a range of blue-collar jobs, from higher pay ones to ones that pay out less.
However, big paychecks can come with big bills- so next we looked at average home costs according to the Census. Owning a home is part of the American dream, just like a well-paying job that doesn’t require drowning in student loans, so a good city for blue-collar workers will have affordable housing.
Finally, we looked at union membership rates by state, from the BLS. Stronger unions lead to higher pay and better future opportunities for blue collar workers.
1. Buffalo, New York

Wage: $42,129
Home Price: $98,309
Union Membership: 23%
With median income for blue-collar workers at $42,129 and union membership rates at 22.7%, it’s no surprise that Buffalo, New York comes in at No. 1 on this list. Even the average home price of $98,309 is feasible compared to other cities on this list.
2. Warren, Michigan

Wage: $52,989
Home Price: $138,163
Union Membership: 15%
Warren, Michigan is named second on the list understandably with the average home price a bit higher than the No. 1 spot and the union membership rates considerably lower. However, with the city’s average blue-collar income of $52,989, workers should have no trouble paying the extra money for a home.
3. Rochester, New York
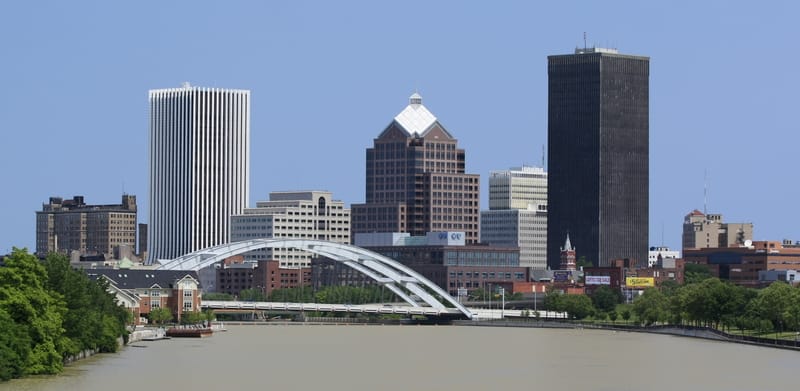
Wage: $40,012
Home Price: $82,741
Union Membership: 23%
Offering an average salary of $40,012, it’s easy to see why Rochester, New York is third on the list. But with the average home only costing $82,741, blue-collar workers won’t have that hard of a time paying off a home.
4. Springfield, Illinois
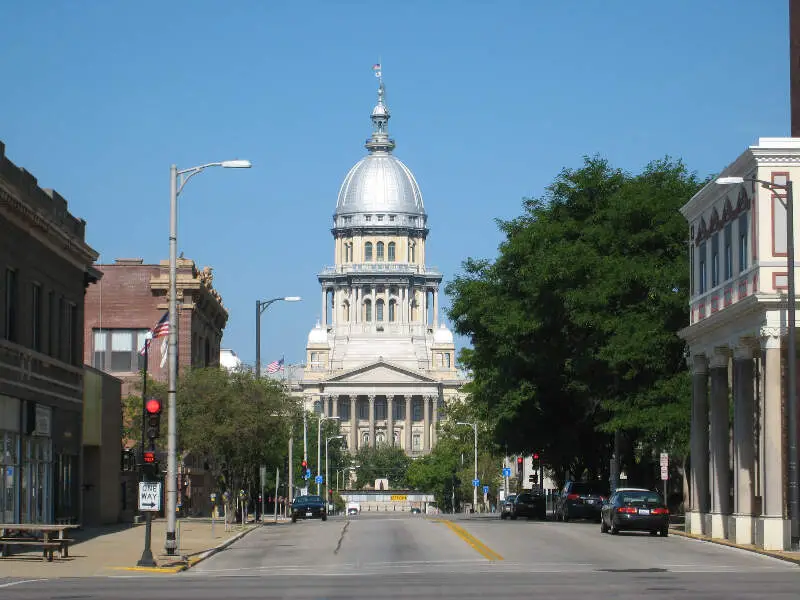
Wage: $48,036
Home Price: $123,271
Union Membership: 15%
Coming in at No. 4, Springfield, Illinois boasts an average income of $48,036. But the higher income comes at a cost. The average home there costs roughly $123,271 and the union membership rates are only at 14.7%.
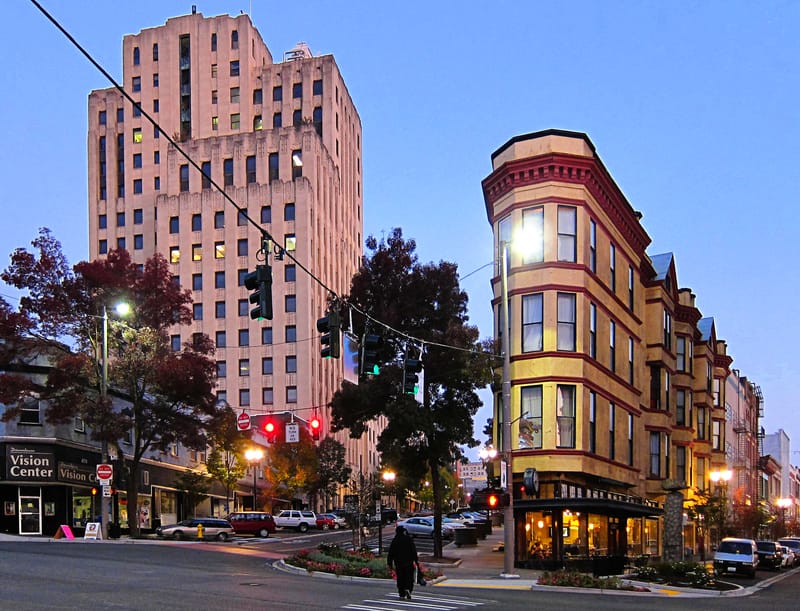
5. Paterson, New Jersey

Wage: $54,791
Home Price: $255,990
Union Membership: 17%
Paterson, New Jersey completes the first half of the list with an average salary of $54,791 and union membership rates at 17.4%. The only downside is that houses aren’t cheap here as the average house costs $255,990.
6. Tacoma, Washington
Wage: $52,186
Home Price: $309,939
Union Membership: 20%
Taking the sixth spot, Tacoma, Washington offers blue-collar workers an average salary of $52,186. A bonus of living in Tacoma is that union membership rates are at 20.2%. The bad news is that the average house costs $309,939.
7. Fort Wayne, Indiana
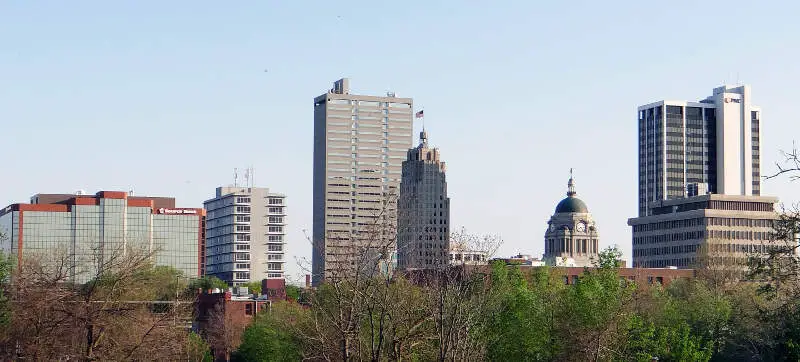
Wage: $44,754
Home Price: $115,658
Union Membership: 10%
Fort Wayne, Indiana offers blue-collar workers a decent salary without the average cost of a home being too expensive. The downside to living in Fort Wayne is the incredibly low number of union membership rates.
8. Independence, Missouri

Wage: $43,796
Home Price: $117,641
Union Membership: 13%
The No. 8 spot on this list is occupied by Independence, Missouri. As for the numbers that we found to support this ranking, all were fairly low for blue-collar workers. The average salary definitely isn’t the highest and the housing costs in Independence are not too expensive.
9. Yonkers, New York
Wage: $53,643
Home Price: $427,048
Union Membership: 23%
You’d be Yonkers to live here (just kidding). Yonkers, New York is tied for being the ninth-best city for blue-collar workers. While you’ll earn a decent salary here, you may not be able to buy a home as the average house costs $427,048.
9. Anchorage, Alaska

Wage: $50,520
Home Price: $321,260
Union Membership: 19%
Living in Alaska may be cold, but the opportunity for blue-collar workers is hot. With an average salary of $50,520, it seems that most of these workers make a decent living in Anchorage. And although the average cost of houses is high, the amount of union membership remains on the higher end.
Summary of Best Cities for Blue Collar Workers
Blue-collar workers work hard for a living. The last thing they should have to worry about is where they can get the most bang for their buck. This list highlights all of the best cities based on average income, cost of houses and union membership rates. Check the table below for more cities that are great for blue-collar workers.
Top Cities for Blue Collar Workers
| Rank | City | Wage | Home Price | Union Membership |
|---|---|---|---|---|
| 1 | Buffalo, New York | $42,129 | $98,309 | 22 |
| 2 | Warren, Michigan | $52,989 | $138,163 | 15 |
| 3 | Rochester, New York | $40,012 | $82,741 | 22 |
| 4 | Springfield, Illinois | $48,036 | $123,271 | 14 |
| 5 | Paterson, New Jersey | $54,791 | $255,990 | 17 |
| 6 | Tacoma, Washington | $52,186 | $309,939 | 20 |
| 7 | Fort Wayne, Indiana | $44,754 | $115,658 | 9 |
| 8 | Independence, Missouri | $43,796 | $117,641 | 12 |
| 9 | Yonkers, New York | $53,643 | $427,048 | 22 |
| 9 | Anchorage, Alaska | $50,520 | $321,260 | 18 |
| 11 | Lancaster, California | $48,450 | $290,643 | 16 |
| 12 | Aurora, Illinois | $48,120 | $193,865 | 14 |
| 12 | Dayton, Ohio | $40,837 | $66,534 | 13 |
| 14 | Bakersfield, California | $44,839 | $257,213 | 16 |
| 15 | Vancouver, Washington | $47,829 | $325,545 | 20 |
| 15 | Modesto, California | $48,800 | $313,851 | 16 |
| 17 | Joliet, Illinois | $47,884 | $200,942 | 14 |
| 17 | Kansas City, Kansas | $42,386 | $102,568 | 10 |
| 19 | Elk Grove, California | $58,772 | $444,149 | 16 |
| 20 | Rancho Cucamonga, California | $73,115 | $549,939 | 16 |
| 20 | North Las Vegas, Nevada | $51,557 | $262,169 | 16 |
| 22 | Stockton, California | $47,004 | $299,776 | 16 |
| 22 | Akron, Ohio | $40,166 | $84,264 | 13 |
| 24 | Syracuse, New York | $32,569 | $96,179 | 22 |
| 25 | Santa Clarita, California | $65,852 | $576,037 | 16 |
| 25 | Chula Vista, California | $59,986 | $532,714 | 16 |
| 27 | Roseville, California | $56,198 | $470,860 | 16 |
| 27 | Lansing, Michigan | $38,512 | $88,493 | 15 |
| 27 | Pittsburgh, Pennsylvania | $42,369 | $140,158 | 13 |
| 30 | Concord, California | $64,123 | $611,079 | 16 |
| 31 | Ontario, California | $51,118 | $406,841 | 16 |
| 32 | Hayward, California | $58,942 | $638,645 | 16 |
| 33 | Rockford, Illinois | $38,133 | $92,769 | 14 |
| 34 | Spokane, Washington | $39,427 | $203,671 | 20 |
| 34 | Torrance, California | $71,000 | $823,002 | 16 |
| 34 | Palmdale, California | $45,304 | $306,792 | 16 |
| 37 | Hartford, Connecticut | $40,930 | $166,176 | 16 |
| 38 | Huntington Beach, California | $62,347 | $830,995 | 16 |
| 39 | Fullerton, California | $56,940 | $664,083 | 16 |
| 39 | Topeka, Kansas | $40,287 | $109,715 | 10 |
| 41 | Glendale, California | $61,621 | $877,359 | 16 |
| 41 | Fontana, California | $47,807 | $406,699 | 16 |
| 43 | Kansas City, Missouri | $42,969 | $166,353 | 12 |
| 44 | Omaha, Nebraska | $45,500 | $163,383 | 9 |
| 45 | Santa Rosa, California | $52,186 | $584,267 | 16 |
| 46 | Urban Honolulu, Hawaii | $49,214 | $705,377 | 25 |
| 46 | Enterprise, Nevada | $51,796 | $341,201 | 16 |
| 46 | Henderson, Nevada | $51,478 | $339,857 | 16 |
| 49 | Detroit, Michigan | $35,303 | $51,616 | 15 |
| 50 | Bellevue, Washington | $52,792 | $924,546 | 20 |
| 50 | Philadelphia, Pennsylvania | $42,007 | $167,663 | 13 |
| 52 | San Francisco, California | $57,438 | $1,195,732 | 16 |
| 52 | Evansville, Indiana | $39,774 | $102,760 | 9 |
| 54 | Long Beach, California | $49,894 | $600,678 | 16 |
| 55 | Irvine, California | $53,469 | $843,596 | 16 |
| 56 | San Bernardino, California | $41,241 | $270,317 | 16 |
| 56 | Baltimore, Maryland | $42,243 | $167,840 | 12 |
| 58 | Columbus, Ohio | $40,449 | $159,368 | 13 |
| 59 | Peoria, Illinois | $37,294 | $128,848 | 14 |
| 60 | Chicago, Illinois | $46,825 | $271,600 | 14 |
| 61 | Cleveland, Ohio | $35,835 | $71,080 | 13 |
| 62 | Oakland, California | $48,824 | $717,699 | 16 |
| 63 | New York, New York | $45,805 | $645,147 | 22 |
| 64 | Port St. Lucie, Florida | $52,216 | $233,053 | 7 |
| 65 | San Jose, California | $49,702 | $968,521 | 16 |
| 65 | Sunrise Manor, Nevada | $39,324 | $190,079 | 16 |
| 67 | Jersey City, New Jersey | $43,567 | $416,935 | 17 |
| 67 | Newark, New Jersey | $38,323 | $251,831 | 17 |
| 69 | Milwaukee, Wisconsin | $40,099 | $126,286 | 9 |
| 70 | Springfield, Massachusetts | $38,747 | $159,237 | 13 |
| 71 | Lafayette, Louisiana | $52,393 | $208,122 | 6 |
| 72 | Oceanside, California | $44,130 | $527,070 | 16 |
| 72 | Pueblo, Colorado | $39,779 | $153,905 | 9 |
| 72 | Corpus Christi, Texas | $45,518 | $146,017 | 5 |
| 75 | Las Vegas, Nevada | $42,494 | $284,992 | 16 |
| 75 | Wichita, Kansas | $38,265 | $139,759 | 10 |
| 77 | Thornton, Colorado | $54,667 | $358,747 | 9 |
| 78 | Providence, Rhode Island | $35,218 | $219,488 | 19 |
| 78 | Reno, Nevada | $45,352 | $364,548 | 16 |
| 80 | Riverside, California | $41,927 | $384,965 | 16 |
| 80 | St. Louis, Missouri | $38,371 | $154,759 | 12 |
| 80 | Birmingham, Alabama | $35,425 | $93,407 | 9 |
| 80 | Clearwater, Florida | $46,046 | $218,577 | 7 |
| 84 | San Diego, California | $44,495 | $654,737 | 16 |
| 84 | Toledo, Ohio | $32,934 | $79,886 | 13 |
| 86 | Seattle, Washington | $43,889 | $758,230 | 20 |
| 86 | Arvada, Colorado | $60,791 | $434,850 | 9 |
| 88 | Fremont, California | $45,955 | $1,058,230 | 16 |
| 88 | Mobile, Alabama | $36,604 | $125,134 | 9 |
| 90 | Escondido, California | $42,297 | $466,882 | 16 |
| 90 | New Haven, Connecticut | $39,237 | $211,381 | 16 |
| 90 | Surprise, Arizona | $53,230 | $260,460 | 7 |
| 93 | Indianapolis , Indiana | $37,713 | $142,659 | 9 |
| 94 | Amarillo, Texas | $42,699 | $137,594 | 5 |
| 95 | Stamford, Connecticut | $47,929 | $528,932 | 16 |
| 96 | Fresno, California | $36,733 | $257,150 | 16 |
| 96 | Oklahoma City, Oklahoma | $40,680 | $161,741 | 7 |
| 98 | Laredo, Texas | $41,588 | $124,837 | 5 |
| 99 | Arlington, Texas | $47,265 | $188,824 | 5 |
| 100 | Grand Rapids, Michigan | $34,421 | $154,634 | 15 |
Author
Amanda Postma is a writer for the Zippia Career Advice blog with a focus on creating entertaining content to help you through your job search. She received her BA from the University Of Missouri-Columbia.


