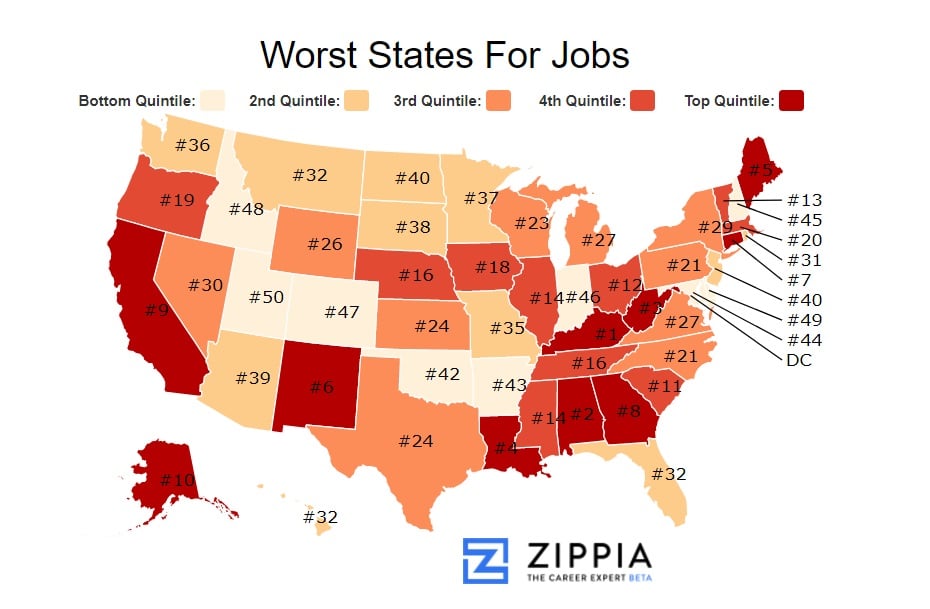
The 10 Worst States for Jobs in America (And The Best)
The worst state for jobs in the U.S. is Kentucky, with an unemployment rate of 5.4% and a job growth rate of -1.49%.
The best state for jobs in the U.S. is Utah, with an unemployment rate of 4.20% and a job growth rate of 2.58%.
The state with the highest job growth rate is Delaware, at a rate of 3.94%.
The state with the highest unemployment is New Mexico at a rate of 7%.
When evaluating the best places to live and work, significant disparities exist among states in the U.S. While some areas thrive, others grapple with persistent economic challenges.
Many states have been facing issues such as poverty, an aging workforce, and rising living costs. These factors have led to increased job competition and economic inequality, which can heavily impact employment opportunities.
Previously, we explored the best states in America for job seekers. This time, we delved into identifying the states that currently present the greatest challenges for employment. Have conditions changed since our last report? We analyzed the latest data to uncover the worst states for jobs in 2026.
Here’s a quick overview of the top ten states where job seekers may face the most difficulties:
We’ll examine the statistics for each of these states in detail further down, but first, let’s discuss how we compiled this list.
How We Did It
We considered several critical factors to determine the job market conditions in each state:
-
Unemployment rate
-
Recent job growth
-
Projected future job growth
-
State income tax
-
Median household income adjusted for the cost of living
-
Average work hours closer to 39
All data sources were obtained from Sperling’s Best Places. We utilized research, such as a study that identifies the 39-hour work week as the most productive, to finalize our work hour criteria. Deviations from this benchmark negatively affect a state’s ranking.
After gathering the data, we ranked each state from 1 to 50 across all criteria, with 1 representing the best. The state with the lowest overall score was designated as the “Worst State to Get a Job.”
Curious about how your state ranks? Keep reading for the full list.
1. Kentucky
Unemployment Rate: 5.40%
Recent Job Growth: -1.49%
Cost of Living Index: 90.5
Once a major coal supplier in the U.S., Kentucky struggles to recover from the decline of the coal industry and the lasting effects of the Great Recession. Despite some recent gains, its job growth remains at -1.49%, and many areas in the state continue to face challenges related to education and income, placing Kentucky at the top of our list.
2. Alabama
Unemployment Rate: 6.50%
Recent Job Growth: 0.04%
Cost of Living Index: 91.2
Alabama’s job growth has stagnated at 0.04%, with an unemployment rate of 6.50%. While an automobile manufacturing boom offers some hope, it also brings challenges, such as low wages and limited training opportunities, contributing to a difficult employment landscape.
3. West Virginia
Unemployment Rate: 6.10%
Recent Job Growth: -0.72%
Cost of Living Index: 93.4
West Virginia’s job growth remains stagnant at -0.72%, and its unemployment rate of 6.10% reflects the ongoing economic struggles. This state, with a history of labor disputes and economic challenges, is hoping for a turnaround in the near future.
4. Louisiana
Unemployment Rate: 7.00%
Recent Job Growth: 0.32%
Cost of Living Index: 94.8
Louisiana faces one of the highest unemployment rates on our list at 7.00%. With a recent job growth rate of only 0.32%, it continues to be another Southern state grappling with economic challenges.
5. Maine
Unemployment Rate: 3.70%
Recent Job Growth: -1.13%
Cost of Living Index: 110.8
Maine, the first New England state on our list, posts a relatively low unemployment rate of 3.70%. However, its job growth rate of -1.13% combined with a cost of living 10% higher than the national average positions it at number 5 in our rankings.
6. New Mexico
Unemployment Rate: 7.00%
Recent Job Growth: -0.01%
Cost of Living Index: 96.5
Tied with Louisiana, New Mexico’s unemployment rate stands at 7.00%, coupled with a stagnant job growth rate of -0.01%. This combination places New Mexico at number 6 on our list of the worst states for jobs.
7. Connecticut
Unemployment Rate: 5.90%
Recent Job Growth: 1.13%
Cost of Living Index: 127.7
Connecticut, another New England state, shows a job growth rate of 1.13%. However, its high unemployment rate of 5.90% and a cost of living that is 27.7% above the national average contribute to its position in our rankings.
8. Georgia
Unemployment Rate: 5.60%
Recent Job Growth: 1.68%
Cost of Living Index: 91.4
Georgia’s unemployment rate of 5.60% is not the worst, and its job growth rate of 1.68% is relatively better than many on this list. However, the overall picture for job seekers remains challenging, landing Georgia in the eighth position.
9. California
Unemployment Rate: 5.70%
Recent Job Growth: 2.18%
Cost of Living Index: 135.9
Surprisingly, California ranks high on our list despite its reputation for opportunity, particularly in tech. With an unemployment rate of 5.70% and the second highest cost of living in the nation, behind only Hawaii, challenges persist for job seekers.
10. Alaska
Unemployment Rate: 6.80%
Recent Job Growth: -0.17%
Cost of Living Index: 131.1
Alaska, known for its stunning landscapes, faces significant employment challenges. With an unemployment rate of 6.80% and a job growth rate of -0.17%, coupled with a high cost of living, it ranks as one of the worst states for jobs.
Wrapping Up
Below, you’ll find our extended table with comprehensive data. For more insights, visit Zippia.
Are you on the job hunt? Discover how to effectively answer the interview question “Why are you looking for a new job?”.
Looking for more articles like this? Check out the best accounting companies to work for in Birmingham, AL.
| Rank | State | Median Income |
|---|---|---|
| 1 | Kentucky | $43,342 |
| 2 | Alabama | $43,511 |
| 3 | West Virginia | $41,576 |
| 4 | Louisiana | $44,991 |
| 5 | Maine | $48,804 |
| 6 | New Mexico | $44,968 |
| 7 | Connecticut | $69,899 |
| 8 | Georgia | $49,342 |
| 9 | California | $61,489 |
| 10 | Alaska | $71,829 |
| 11 | South Carolina | $45,033 |
| 12 | Ohio | $48,849 |
| 13 | Vermont | $54,447 |
| 14 | Illinois | $57,166 |
| 14 | Mississippi | $39,464 |
| 16 | Nebraska | $52,400 |
| 16 | Tennessee | $44,621 |
| 18 | Iowa | $52,716 |
| 19 | Oregon | $50,521 |
| 20 | Massachusetts | $67,846 |
| 21 | North Carolina | $46,693 |
| 21 | Pennsylvania | $53,115 |
| 23 | Wisconsin | $52,738 |
| 24 | Kansas | $51,872 |
| 24 | Texas | $52,576 |
| 26 | Wyoming | $58,252 |
| 27 | Michigan | $49,087 |
| 27 | Virginia | $64,792 |
| 29 | New York | $58,687 |
| 30 | Nevada | $52,205 |
| 31 | Rhode Island | $56,423 |
| 32 | Florida | $47,212 |
| 32 | Hawaii | $68,201 |
| 32 | Montana | $46,766 |
| 35 | Missouri | $47,764 |
| 36 | Washington | $60,294 |
| 37 | Minnesota | $60,828 |
| 38 | South Dakota | $50,338 |
| 39 | Arizona | $49,928 |
| 40 | New Jersey | $72,062 |
| 40 | North Dakota | $55,579 |
| 42 | Oklahoma | $46,235 |
| 43 | Arkansas | $41,264 |
| 44 | Maryland | $74,149 |
| 45 | New Hampshire | $65,986 |
| 46 | Indiana | $48,737 |
| 47 | Colorado | $59,448 |
| 48 | Idaho | $47,334 |
| 49 | Delaware | $60,231 |
| 50 | Utah | $59,846 |
Author
Ryan Morris was a writer for the Zippia Advice blog who tried to make the job process a little more entertaining for all those involved. He obtained his BA and Masters from Appalachian State University.