- Industry Statistics
- Wedding Industry Statistics
- Yoga Industry Statistics
- Music Industry Statistics
- Landscaping Industry Statistics
- Bicycle Industry Statistics
- Coffee Industry Statistics
- Car Rental Industry Statistics
- Home Improvement Industry Statistics
- Insurance Industry Statistics
- Supplements Industry Statistics
- Golf Industry Statistics
- Fitness Industry Statistics
- US Media And Entertainment Industry Statistics
- Firearm Industry Statistics
- Financial Services Industry Statistics
- Health And Wellness Industry Statistics
- Trucking Industry Statistics
- Wine Industry Statistics
- Pet Industry Statistics
- Mobile App Industry Statistics
- Digital Marketing Industry Statistics
- Hotel Industry Statistics
- Retail Statistics
- Robotics Industry Statistics
- Jewelry Industry Statistics
- Appointment Scheduling statistics
- Restaurant Industry Statistics
- Food Delivery Statistics
- Food Truck Industry
- Fashion Industry
- Real Estate Industry
- US Film Industry
- US Beverage Industry
- USu202fFast Food Restaurants
- US Construction Industry
- US Book Industry
- Cosmetics Industry
- US Food Retail Industry
- US Pharmaceutical Industry
- US Healthcare Industry
- Airline Industry
- Automobile Industry
- Transportation Industry Statistics
- Event Industry Statistics
- Project Management Statistics
- Oil And Gas Industry Statistics
- Nursing Home Statistics
- Nursing Shortage Statistics
- Nursing Statistics
28 Astonishing U.S. Healthcare Industry Statistics [2026]: U.S. Healthcare Industry Overview
Research Summary. The U.S. healthcare industry stands as the third-largest sector in the nation, influencing the lives of nearly every American. Despite the significant expenditure on healthcare, which remains the highest globally, many U.S. citizens still bear a substantial portion of these costs. After comprehensive analysis, our data team has concluded the following:
-
Healthcare spending constituted 18.3% of the U.S. economy in 2021, translating to $4.3 trillion in revenue.
-
14% of U.S. adults are employed within the healthcare industry.
-
An average American couple aged 65 and over requires approximately $315,000 saved for medical expenses during retirement.
-
43.4% of adult Americans are inadequately insured, and 20% lack the financial means to access necessary healthcare services.
-
The U.S. ranks as the 35th healthiest country worldwide.
-
As of 2023, one-third of U.S. adults had a telehealth visit for themselves or a dependent.
For a deeper understanding, we have categorized the data into the following areas:
Costs | Patient Use and Opinion | Technology

General U.S. Healthcare Industry Statistics
-
Healthcare is the third-largest industry in the U.S.
As of 2021, healthcare spending accounted for 18.3% of the U.S. GDP, increasing from 5% just 60 years prior. This growth is attributed to various factors, including advancements in healthcare treatments and services, improved coverage, and rising prices across multiple sectors, such as:
-
Health insurance
-
Healthcare marketing
-
Pharmaceuticals
-
Healthcare technology
-
Health administration
While this expansion is beneficial, it raises concerns regarding sustainability as healthcare becomes an increasingly significant component of the economy and government budgets.
-
-
In 2021, healthcare revenue in the U.S. reached $4.3 trillion.
This equates to $12,914 spent per person on healthcare, marking a 2.7% increase from 2020.
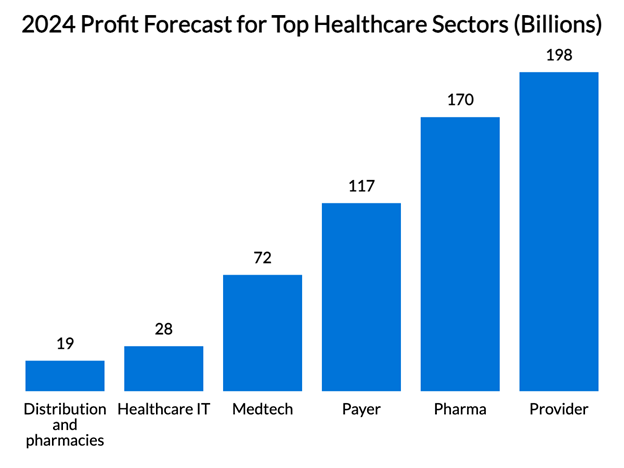
Projections for 2024 indicate that various healthcare sectors will generate the following profits:
-
Healthcare IT: $27.9 billion
-
Distribution and pharmacies: $18.9 billion
-
Payer: $116.6 billion
-
Provider: $197.8 billion
-
Medtech: $72.1 billion
-
Pharma: $169.9 billion
-
-
Approximately one in eight U.S. citizens works in the healthcare industry.
The U.S. Health Care and Social Assistance sector comprises 907,426 businesses, employs 20 million individuals, and boasts an annual payroll exceeding $1.0 trillion as of 2018, alongside over 1.2 million job openings each year.
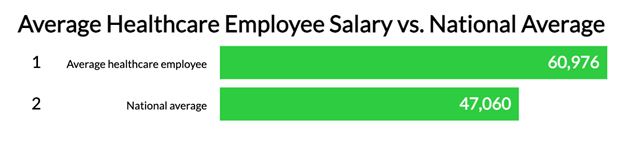
Given the substantial financial flow into the system, jobs in healthcare offer significantly higher wages: the average salary of a healthcare employee in the U.S. stands at $60,976, compared to the national average of $47,060.
Forecasts suggest that healthcare employment will grow by 15% through 2029 (adding 2.4 million jobs), significantly outpacing the average growth rate for all occupations. By 2030, the U.S. is expected to face around 122,000 unfilled positions for physicians.
-
Not all healthcare jobs offer salaries above the national average.
While the aging population is likely to boost future demand for healthcare services, not every role in the sector will experience wage growth.
For instance, positions such as registered nurses, physicians, and surgeons tend to command higher salaries, while roles in healthcare support, including home health aides and medical transcriptionists, often earn less than the median annual wage of $29,960 (as of May 2020).
-
CVS Health Corp. is the largest U.S.-based healthcare company, with annual revenue of $315.2 billion.
It is followed by UnitedHealth Group and McKesson Corp. Below is the list of the ten largest healthcare companies in the U.S. as of the end of 2022:
Largest Healthcare Companies in the U.S. by Revenue
Company Annual Revenue CVS Health Corp. $315.2 billion UnitedHealth Group Inc. $313.1 billion McKesson Corp. $272 billion AmerisourceBergen Corp. $238.6 billion Cardinal Health Inc. $187 billion Cigna Corp. $180 billion Elevance Health $153.2 billion Centene Corp. $141.6 billion Walgreens Boots Alliance $132.7 billion Pfizer $99.9 billion -
There are approximately 6,210 registered hospitals in the U.S.
Patients admitted to these hospitals for acute care typically stay an average of 5.5 days.
Healthcare Costs Statistics
-
91.7% of Americans had either private or government health insurance for all or part of 2021.
From 2020 to 2021, the uninsured population decreased from 28.3 million to 27.2 million.
However, 43.4% of adult Americans remain inadequately insured, and 20% cannot afford necessary healthcare, contributing to 62.1% of all bankruptcies being caused by high medical bills.
Consequently, one in four Americans avoid visiting doctors due to the high cost of care.
-
As of 2018, 34% of Americans received their health care via government insurance or direct public provision.
Healthcare’s share of total government spending has doubled over the last three decades, now accounting for 24.1% as of 2018. As of 2019, 18.1% of Americans were covered by Medicare.
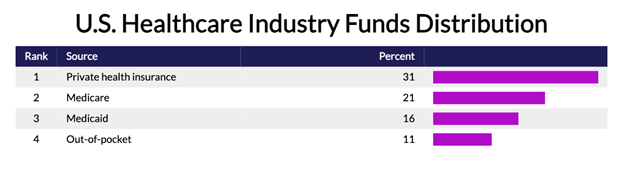
Still, private health insurance represents 31% of healthcare funding in the U.S., with Medicare (21%), Medicaid (16%), and out-of-pocket payments (11%) following.
-
Employers cover 82% of healthcare costs.
However, many Americans face significant out-of-pocket expenses. As of 2017, more than one in 50 individuals using the healthcare system incurred costs exceeding $5,000, and one in 200 faced costs over $10,000.
And what happens when you retire? An average American couple aged 65 and over needs approximately $315,000 saved for medical expenses during retirement.
-
Healthcare costs vary significantly across regions in the U.S.
Costs in the U.S. are approximately twice as high as in other countries, mainly due to expensive specialized treatments and procedures, such as MRIs and hip replacements.
However, this is not uniform. For instance, healthcare spending per privately insured person can differ threefold across various regions. Even within the same city, prices for the same service can vary widely.
-
What are the top 20 most expensive health conditions in the United States?
20 Most Expensive Health Conditions in the U.S. Condition Average Cost Per Stay Heart valve disorders $41,878 Acute myocardial infarction (heart attack) $20,086 Complication of device, implant, or graft $19,669 Coronary atherosclerosis $19,657 Spondylosis, intervertebral disc disorders, other back problems $18,375 Respiratory failure, insufficiency, arrest $18,287 Septicemia $18,244 Osteoarthritis $16,149 Fracture of neck of femur (hip) $16,043 Acute cerebrovascular disease $15,111 Rehabilitation care, fitting of prostheses, and adjustment of devices $13,777 Complications of surgical procedures or medical care $13,073 Biliary tract disease $11,659 Congestive heart failure $11,585 Cardiac dysrhythmias $10,110 Pneumonia $9,887 Diabetes mellitus with complications $9,684 Chronic obstructive pulmonary disease and bronchiectasis $8,034 Mood disorders $6,275 Liveborn $3,529 -
In 2021, U.S. healthcare expenditure totaled $4.3 trillion, or 18.3% of the GDP.
This figure was just over 8% of GDP in 1980.
By 2028, total expenditures are projected to rise to around $6.2 trillion.
-
Healthcare administrative spending represents 8% of the U.S. GDP, in contrast to 3% in other nations.
The U.S. could potentially save $175 billion in healthcare costs by reducing administrative expenses by half.
-
Healthcare and other costs attributable to opioid misuse burden the U.S. with $78.5 billion annually.
Additionally, alcohol abuse incurs healthcare costs of $27 billion per year, while obesity is linked to 300,000 premature deaths each year.
-
U.S. national health expenditures have nearly tripled since 1970.
Health spending by service or product type includes:
-
Hospital care (31%)
-
Physician and clinical services (20%)
-
Retail prescription drugs (10%)
-
Other health, residential, and personal care services (5%)
-
Nursing care facilities and continuing care retirement communities (5%)
-
Dental services (4%)
-
Home health care (3%)
-
Other professional services (3%)
-
Other non-durable medical products (2%)
-
Durable medical equipment (2%)
-
U.S. Healthcare Statistics By Patient Use and Opinion
-
61% of Americans do not believe that the U.S. has the best healthcare system in the world.
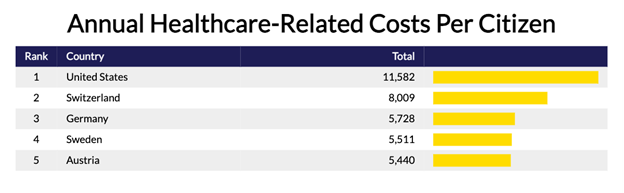
The U.S. spends $11,582 in healthcare-related costs per citizen annually, compared to other leading nations such as Switzerland ($8,009), Germany ($5,728), Sweden ($5,511), and Austria ($5,440).
Despite this financial investment, the U.S. ranks as the 35th healthiest country globally. Furthermore, it has:
-
Lowest life expectancy
-
Highest suicide rates
-
Highest chronic disease burden
-
Highest number of hospitalizations from preventable causes
-
Highest rate of avoidable deaths
-
Lowest survival rate for cervical cancer
-
An obesity rate that is two times higher than ten other high-income countries
On a positive note, the U.S. also has one of the highest rates of breast cancer screening among women ages 50 to 69, the second-highest rate (after the U.K.) of flu vaccinations among those aged 65 and older, and the highest average five-year survival rate for breast cancer (90.2%).
-
-
As of 2017, Americans visit a physician an average of four times per year, which is fewer than in seven other high-income countries.
This is largely due to the fact that there are only 2.6 physicians for every 10,000 U.S. residents, the lowest rate among ten other high-income countries.
-
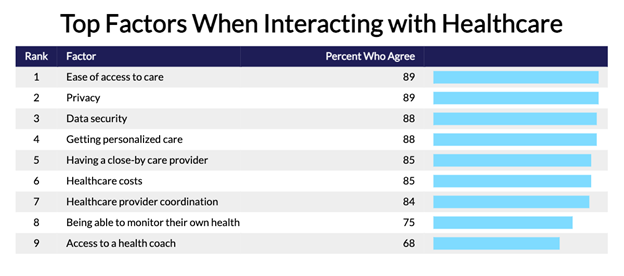
According to U.S. adults, key factors in healthcare interactions include:
-
Ease of access to care (89%)
-
Privacy (89%)
-
Data security (88%)
-
Personalized care (88%)
-
Proximity of a care provider (85%)
-
Healthcare costs (85%)
-
Coordination among healthcare providers (84%)
-
Ability to monitor personal health (75%)
-
Access to a health coach (68%)
-
-
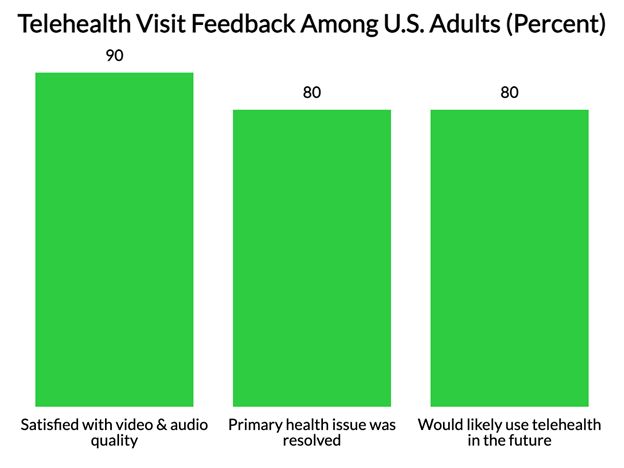
One-third of U.S. adults utilized telehealth services in 2020.
63% of U.S. adults accessed telehealth for preventive care, prescription refills, or routine chronic illness management.
During their telehealth visits, over 90% reported satisfaction with video and audio quality, and 80% indicated their primary health issue was resolved during the call. Consequently, 80% expressed a willingness to use telehealth again in the future.
Nonetheless, a significant portion of the population lacks access to telehealth services, as 35% of rural residents and 42% of older adults cited lack of high-speed broadband as a barrier.
Considering these factors, the total U.S. telemedicine market is anticipated to reach $22 billion by 2025.
Healthcare Technology Statistics
-
Effective implementation of IoT-based healthcare technologies could save the U.S. over $300 billion.
60% of healthcare organizations have adopted Internet of Things (IoT) technology, with patient monitors (64%) and X-ray/imaging devices (41%) being the predominant connected devices.
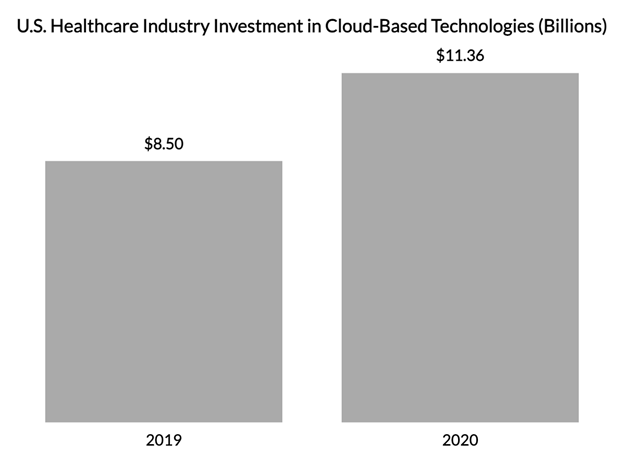
Moreover, investment in cloud-based technologies in the U.S. healthcare sector surged by 33% from 2019 ($8.5 billion) to 2020 ($11.36 billion), and 94% of hospitals are currently adopting electronic health records.
AI applications are poised to be transformative, potentially generating $150 billion in annual savings for the U.S. healthcare economy by 2026.
However, not all technology implementations yield the same benefits. For example, online symptom checkers currently misdiagnose 66% of the time.
-
94% of physicians support improved data interoperability in their organizations, with most (86%) believing the benefits outweigh potential challenges.
63% of physicians cite burdensome reporting systems as their current major pain point.
As a result, nearly 59% of doctors assert that enhanced interoperability will enable quicker identification of high-risk patients, while 95% agree it will ultimately improve patient outcomes.
-
Increased use of healthcare technology raises security concerns.
For instance, the U.S. healthcare industry recorded 599 data breaches in 2020.
California was the state with the highest number of healthcare data breaches in 2020, accounting for 49 incidents. Trinity Health experienced the largest breach, with hackers accessing over 3.3 million records.
U.S. Healthcare Industry Statistics FAQ
-
How much is the healthcare industry worth?
The healthcare industry is valued at $714.5 billion in the United States as of 2021. An impressive 65% of revenue comes from patient care. For comparison, the global health industry is valued at $12 trillion.
-
What percentage of the U.S. economy is made up of the healthcare industry?
The healthcare industry comprises 18.3% of the U.S. economy as of 2021. This is significantly higher than most other developed countries, where healthcare typically accounts for no more than 10% of national GDP.
-
Is healthcare the fastest-growing industry?
Yes, healthcare is the fastest-growing industry. It is the largest and rapidly expanding sector in the U.S. and globally. Employment for healthcare occupations is projected to grow by at least 16% from 2020 to 2030.
Not surprisingly, the healthcare sector is one of the largest and most complex in the U.S. economy, accounting for 18.3% of the country’s GDP in 2021.
-
Is the U.S. healthcare market efficient?
No, the U.S. healthcare market is not efficient. The U.S. healthcare system ranks 22nd out of 27 high-income nations for efficiency in converting healthcare spending into extended lives. Denmark ranks first in healthcare efficiency.
Healthcare market efficiency is assessed by analyzing how much money spent correlates with life expectancy. For instance, every additional $100 spent on healthcare in the United States translates into a gain of less than half a month of life expectancy.
Conversely, in Germany, every additional $100 spent results in over four months of increased life expectancy.
-
How large is the U.S. healthcare industry?
The U.S. healthcare industry is the third-largest industry in the U.S. In 2021, 18.3% of the country’s GDP was allocated to healthcare. The industry generated $4.3 trillion in revenue that same year.
Conclusion
The U.S. healthcare industry generates significant revenue across its diverse sectors and employs a substantial portion of the American workforce. It also leverages advanced technologies that are advancing rapidly.
Despite these strengths, a growing number of Americans question the quality of the U.S. healthcare system, reflecting its medical outcomes in comparison to other wealthy countries. Inadequate insurance coverage and the escalating costs of healthcare remain pressing concerns.
Sources
-
Policy Advice. The State of Healthcare Industry – Statistics for 2021. Accessed on August 23, 2021.
-
The Commonwealth Fund. U.S. Health Care from a Global Perspective, 2019: Higher Spending, Worse Outcomes? Accessed on June 29, 2022.
-
Centers for Medicare and Medicaid Services. 2019 National Health Expenditure Accounts (NHEA). Accessed on June 29, 2022.
-
The Brookings Institution. A dozen facts about the economics of the U.S. healthcare system. Accessed on June 29, 2022.
-
Insider Intelligence. U.S. Healthcare Industry in 2021: Analysis of the health sector, healthcare trends, future of digital health. Accessed on June 29, 2022.
-
Google. Physicians say better data interoperability will save lives. Accessed on June 29, 2022.
-
Bipartisan Policy Center. New Survey: Virtual Care Could Keep Low-Acuity Cases Out of Emergency Department. Accessed on June 29, 2022.
-
MedAlertHelp. 34 Eye-Opening Healthcare Statistics to Know in 2021. Accessed on June 29, 2022.
-
Statista. Profit pool of the U.S. healthcare industry in 2019 and a forecast for 2024, by sector. Accessed on June 29, 2022.
-
Harvard Medical School. Evaluation of symptom checkers for self-diagnosis and triage: audit study. Accessed on June 29, 2022.
-
Centers for Medicare and Medicaid Services. Projections of Health Care Spending for Categories Within the National Health Expenditure Accounts. Accessed on June 29, 2022.
-
Business Insider. The 20 most expensive health conditions in the U.S. Accessed on June 29, 2022.
-
Aranca. IoT Could Save Billions in Healthcare Costs Across the U.S. and Europe. Accessed on June 29, 2022.
-
Statista. Total telemedicine market in the United States from 2014 to 2025. Accessed on June 29, 2022.
-
Accenture. Artificial Intelligence: Healthcare’s New Nervous System. Accessed on June 29, 2022.
-
Hewlett Packard Enterprise. The Internet of Things: Today and Tomorrow. Accessed on June 29, 2022.
-
LoudCloud Health. 10 Key Healthcare Industry Statistics for 2021. Accessed on June 29, 2022.
-
IBISWorld. Health Medical Insurance in the U.S. Accessed on June 29, 2022.
-
Centers for Disease Control and Prevention—National Center for Health Statistics. Fast Stats: Health Expenditures. Accessed on June 29, 2022.
-
United States Census Bureau. Health Care Still Largest U.S. Employer. Accessed on June 29, 2022.
-
U.S. Bureau of Labor and Statistics. Occupational Outlook Handbook: Healthcare Occupations. Accessed on August 23, 2021.
-
CMS.gov. NHE Fact Sheet. Accessed on February 28, 2023.
-
Fidelity. How to Plan for Rising Health Care Costs. Accessed on February 28, 2023.
-
Investopedia. 10 Biggest Healthcare Companies. Accessed on February 28, 2023.
-
United States Census Bureau. Health Insurance Coverage in the United States: 2021. Accessed on February 28, 2023.
- Industry Statistics
- Wedding Industry Statistics
- Yoga Industry Statistics
- Music Industry Statistics
- Landscaping Industry Statistics
- Bicycle Industry Statistics
- Coffee Industry Statistics
- Car Rental Industry Statistics
- Home Improvement Industry Statistics
- Insurance Industry Statistics
- Supplements Industry Statistics
- Golf Industry Statistics
- Fitness Industry Statistics
- US Media And Entertainment Industry Statistics
- Firearm Industry Statistics
- Financial Services Industry Statistics
- Health And Wellness Industry Statistics
- Trucking Industry Statistics
- Wine Industry Statistics
- Pet Industry Statistics
- Mobile App Industry Statistics
- Digital Marketing Industry Statistics
- Hotel Industry Statistics
- Retail Statistics
- Robotics Industry Statistics
- Jewelry Industry Statistics
- Appointment Scheduling statistics
- Restaurant Industry Statistics
- Food Delivery Statistics
- Food Truck Industry
- Fashion Industry
- Real Estate Industry
- US Film Industry
- US Beverage Industry
- USu202fFast Food Restaurants
- US Construction Industry
- US Book Industry
- Cosmetics Industry
- US Food Retail Industry
- US Pharmaceutical Industry
- US Healthcare Industry
- Airline Industry
- Automobile Industry
- Transportation Industry Statistics
- Event Industry Statistics
- Project Management Statistics
- Oil And Gas Industry Statistics
- Nursing Home Statistics
- Nursing Shortage Statistics
- Nursing Statistics
Author
Chris Kolmar is a co-founder of Zippia and the editor-in-chief of the Zippia career advice blog. He has hired over 50 people in his career, been hired five times, and wants to help you land your next job. His research has been featured on the New York Times, Thrillist, VOX, The Atlantic, and a host of local news. More recently, he's been quoted on USA Today, BusinessInsider, and CNBC.