- Industry Statistics
- Wedding Industry Statistics
- Yoga Industry Statistics
- Music Industry Statistics
- Landscaping Industry Statistics
- Bicycle Industry Statistics
- Coffee Industry Statistics
- Car Rental Industry Statistics
- Home Improvement Industry Statistics
- Insurance Industry Statistics
- Supplements Industry Statistics
- Golf Industry Statistics
- Fitness Industry Statistics
- US Media And Entertainment Industry Statistics
- Firearm Industry Statistics
- Financial Services Industry Statistics
- Health And Wellness Industry Statistics
- Trucking Industry Statistics
- Wine Industry Statistics
- Pet Industry Statistics
- Mobile App Industry Statistics
- Digital Marketing Industry Statistics
- Hotel Industry Statistics
- Retail Statistics
- Robotics Industry Statistics
- Jewelry Industry Statistics
- Appointment Scheduling statistics
- Restaurant Industry Statistics
- Food Delivery Statistics
- Food Truck Industry
- Fashion Industry
- Real Estate Industry
- US Film Industry
- US Beverage Industry
- USu202fFast Food Restaurants
- US Construction Industry
- US Book Industry
- Cosmetics Industry
- US Food Retail Industry
- US Pharmaceutical Industry
- US Healthcare Industry
- Airline Industry
- Automobile Industry
- Transportation Industry Statistics
- Event Industry Statistics
- Project Management Statistics
- Oil And Gas Industry Statistics
- Nursing Home Statistics
- Nursing Shortage Statistics
- Nursing Statistics
35 Jaw-Dropping US Real Estate Statistics [2026]: How Many Realtors Are In The US
Real estate research summary. Real estate continues to be a vital aspect of American life, influencing everyone from buyers and sellers to agents. Following the Housing Market Crash of 2008, real estate prices have soared, reaching unprecedented heights. The market dynamics have evolved significantly, especially post-pandemic, with remote work and changing buyer preferences shaping today’s landscape.
If you’re curious about the current state of real estate agents in the U.S. and other key statistics, we have compiled essential insights into the U.S. real estate industry. Based on our thorough research:
-
As of February 2026, there are over 1.53 million realtors operating in the U.S.
-
The total value of U.S. housing stock is approximately $43.4 trillion.
-
Between January 2025 and January 2026, home prices across the U.S. experienced an overall increase of 5.5%.
-
Currently, 97% of homebuyers begin their searches online.
-
The market size of the Real Estate Sales Brokerage industry in the U.S. is estimated at $222.3 billion in 2026.
-
There are approximately 143.8 million housing units in the U.S.
For further analysis, we have categorized the data as follows:
Housing Market | Agent | Trends and Predictions | Home Buyer

General real estate industry statistics
Owning a home has long been a cornerstone of the “American Dream.” However, in recent years, housing prices have significantly outpaced the incomes of many Americans. Here are the latest insights from our research:
-
In 2022, approximately 5.95 million homes were sold in the U.S. This figure has steadily increased since 2011, when sales were only 4.57 million annually. Sales are projected to rise further in 2026.
-
San Francisco, California, currently holds the highest median selling price for U.S. real estate at $1.36 million. The city also has the highest average 5% down payment at $68,000, largely due to its neutral market conditions.
-
Manhattan, New York, boasts the highest cost per square foot in the U.S. at $1,400. Despite being one of the priciest locations, market conditions are influencing prices, as evidenced by a median listing price of $1.6 million and a median selling price of $950,000.
Most expensive cities by cost per square foot
City Median Selling Price Median Listing Price Average Price per Square Foot San Francisco, CA $1.36M $1.3M $1,100 Manhattan, NY $950K $1.6M $1,400 San Jose, CA $983K $925K $610 Bethesda, MD $848K $1.2M $500 Brooklyn, NY $799K $730K $720 Los Angeles, CA $760K $860K $550 Boston, MA $692K $770K $760 Oakland, CA $757K $690K $525 Seattle, WA $751K $690K $520 Honolulu, HI $610K $625K $700 -
Houston, Texas, is currently one of the most attractive real estate markets, with a median listing price of $342,000. Unlike Austin, which has seen rapid price increases recently, Houston remains one of the more affordable housing markets in the U.S.
-
Washington State has the most competitive real estate market, with 44.74% of homes selling above their listing price. Additionally, an average of 68 homes are sold monthly just two weeks after being listed, driven by the presence of major tech companies like Microsoft.
Most competitive real estate markets by state
State % of Homes Sold Above Listing Price Ave. Homes Sold in Less Than 2 Weeks per Month Ave. Monthly Supply of Homes Washington 44.74% 68 1.27 Nebraska 38.80% 68 1.13 Kansas 27.16% 55 0.00 Oregon 38.87% 56 1.71 Utah 40.67% 50 1.50 Minnesota 41.87% 48 1.73 Indiana 25.24% 65 1.23 Idaho 29.51% 59 1.30 Colorado 34.46% 55 1.94 Virginia 37.34% 45 1.57 -
The market size of the Real Estate Sales Brokerage industry in the U.S. is $222.3 billion as of 2026. However, the industry has a modest growth rate of 0.6%. The market size of the industry has been relatively stagnant.
-
In the past few years, there has been a significant shortage of new home supply, with a cumulative shortage estimated at over 5 million. While the number of homes being built has slightly increased, the deficit remains substantial, with 5.24 million fewer housing starts than household formations.
-
REITs (Real Estate Investment Trusts) own approximately $3.5 trillion in gross real estate assets. U.S. REITs contributed around 2.6 million full-time jobs to the economy in previous years.
Housing market statistics
The real estate housing market remains highly competitive and expensive, with significant shortages persisting across the U.S. Here are the latest facts:
-
As of 2023, there are 143.8 million housing units in the U.S. This figure reflects a modest growth of just over 7% since 2010, contrasting sharply with the 18% growth observed between 1980 and 1990.
This marks an increase of 3 million from 2020, when the total housing stock was 140.8 million units.
-
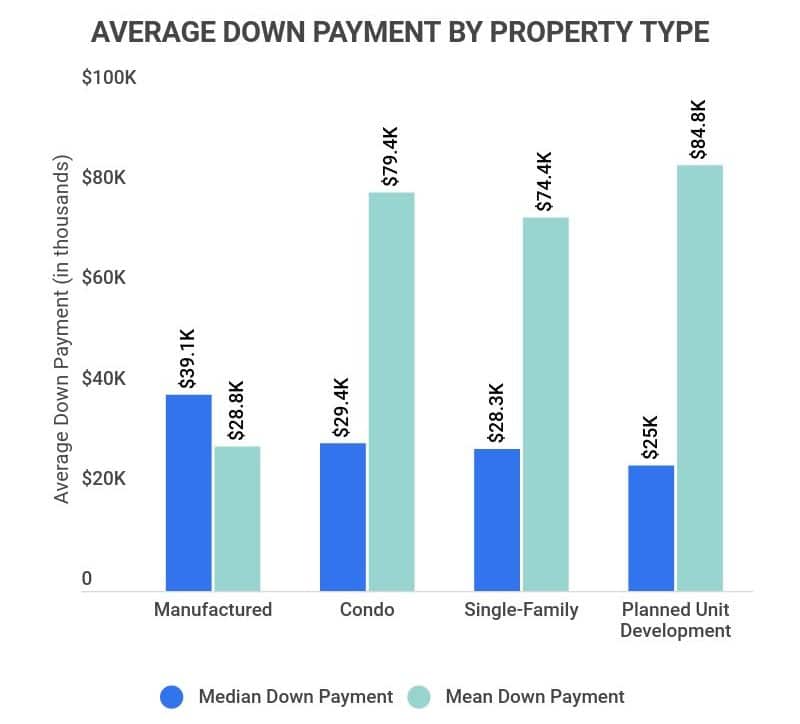
The average down payment for a home in 2026 is $24,100. While this amount may seem substantial, it represents only about 13% of the average home cost, which exceeds $250,000. Most banks typically require a 20% down payment to eliminate mortgage insurance.
-
As of Q3 2023, the median home price in the U.S. is $392,000. This reflects an 8.9% increase compared to 2022 prices and marks a significant increase from $111,000 in 1999.
-
In May 2023, the median cost of a new home in the U.S. reached $436,800. This more than doubles the price from 2000, when the median was $207,000. Prices for new homes saw a slight decrease from 2021 to 2022.
-
On average, it takes 56 days to close a loan for a home purchase. This duration encompasses numerous steps including finding an agent, mortgage pre-approval, making offers, inspections, final mortgage approval, appraisals, and more. Notably, this does not account for the approximately four and a half months required to shop for the right home.
-
As of 2023, there are approximately 16 million vacant houses in the U.S. Although this number has decreased from 17 million in 2019, it remains concerning given the over 580,000 homeless individuals across the country.
Median home price by state
| State | Median Home Price |
|---|---|
| Hawaii | $615.3K |
| California | $505K |
| Massachusetts | $381.6K |
| Colorado | $343.3K |
| Washington | $339K |
| New Jersey | $335.6K |
| Maryland | $314.8K |
| New York | $313.7K |
| Oregon | $312.2K |
| Utah | $279.1K |
| Connecticut | $275.4K |
| Virginia | $273.1K |
| Alaska | $270.4K |
| Nevada | $267.9K |
| Rhode Island | $261.9K |
| New Hampshire | $261.7K |
| Delaware | $251.1K |
| Montana | $230.6K |
| Vermont | $227.7K |
| Arizona | $225.5K |
| Minnesota | $223.9K |
| Wyoming | $220.5K |
| Florida | $215.3K |
| Idaho | $212.3K |
| Illinois | $194.5K |
| North Dakota | $193.9K |
| Maine | $190.4K |
| Wisconsin | $180.6K |
| Pennsylvania | $180.2K |
| Georgia | $176K |
| Texas | $172.5K |
| North Carolina | $172.5K |
| New Mexico | $171.4K |
| Tennessee | $167.2K |
| South Dakota | $167.1K |
| Louisiana | $163.1K |
| South Carolina | $162.3K |
| Missouri | $157.2K |
| Nebraska | $155.8K |
| Michigan | $154.9K |
| Kansas | $151.9K |
| Iowa | $147.8K |
| Ohio | $145.7K |
| Alabama | $142.7K |
| Indiana | $141.7K |
| Kentucky | $141K |
| Oklahoma | $136.8K |
| Arkansas | $127.8K |
| West Virginia | $119.6K |
| Mississippi | $119K |
Real estate agent statistics
Real estate agents are integral to the home buying and selling processes, with most Americans depending on their expertise. According to our findings:
-
Approximately 1.46 million real estate agents are currently active in the U.S. This number represents a 29% increase since 2012, when there were about 1 million agents. There are currently 106,548 real estate brokerage firms in operation across the country.
-
Pennsylvania is the leading state for real estate agents. While states like New York may offer higher average annual salaries, Pennsylvania compensates with a lower cost of living. The average annual salary for a real estate agent in PA is a robust $96,244, with 1,743 available real estate jobs, the most of any state.
-
The average commission for a real estate agent is 6% of a home’s sales price. Therefore, on a $250,000 home sale, an agent could earn approximately $15,000. This commission applies to both the buyer’s and seller’s agent.
-
87% of real estate agents do not succeed within their first five years. Many enter the field due to the potential for high earnings, but the competitive landscape can hinder their success.
-
75% of homebuyers work with the first agent they contact. Another 15% choose their second option, underscoring the importance of a real estate agent’s initial interaction with potential clients. Additionally, 33% of buyers will opt for a realtor they’ve previously worked with.
Real estate industry trends and predictions
The real estate market has seen consistent increases in home prices, but will this trend persist? The industry has shown resilience even through recent economic fluctuations. Here are the latest insights:
-
Home prices increased by 13.2% from May 2020 to May 2021. Many sought-after locations experienced substantial price surges, such as Austin, Texas with a 30.5% increase and Phoenix, Arizona with a 23.5% increase.
-
On average, homes appreciate by 3.5% to 3.8% annually. This contrasts sharply with the 13% appreciation seen recently, emphasizing the notable market fluctuations.
-
Experts predict that the growth of housing prices will stabilize around 4.4% in 2026. While the market is anticipated to maintain upward momentum, a crash is unlikely.
-
From 2016 to 2026, the U.S. real estate industry is expected to experience a CAGR of 7%. This aligns with the global forecast of 8%, indicating a positive outlook for the real estate sector.
Home buyer statistics
As the real estate landscape shifts, understanding buyer behaviors is crucial. Here are the latest trends:
-
Millennials (ages 22-40) represent 37% of the home-buying market. Older millennials (31-40 years) account for 23%. Meanwhile, Baby Boomers and Gen X comprise significant portions of the market at 18% and 24%, respectively.
-
On average, homebuyers visit ten homes before making a purchase decision. This process typically spans several weeks, though individual experiences may vary significantly.
-
81% of millennials aged 22-38 discover homes through mobile apps. In comparison, only 54% of Baby Boomers aged 73 and older utilize this method, although older generations often report higher satisfaction with online home-buying services.
-
The average American allocates 16.4% of their income to housing. Although this percentage is high for the decade, it remains historically low compared to previous periods.
-
As of 2021, 88% of buyers engaged real estate agents or brokers. This marks a significant increase from 2001, when only 69% utilized professional services for home purchases.
-
The average income of first-time homebuyers is $67,342 annually. However, this figure can be misleading, as at least half of first-time homebuyers earn less than $60,000 per year.
Real estate industry FAQ
-
How many real estate agents are in the U.S. in 2026?
There are over 1.53 million real estate agents operating in the U.S. as of February 2026. These agents work independently or at one of the more than 106,000 real estate brokerage firms across the country.
Real estate remains an attractive career due to the high average salary exceeding $90,000 per year. However, 87% of agents do not succeed, making it essential to understand the market and build a strong network.
-
How much is the real estate industry worth?
The U.S. real estate industry is valued at $222.3 billion. This figure reflects the business of real estate agents, brokers, and other professionals, distinct from the value of homes and commercial properties.
The total value of commercial properties is estimated at $16 trillion, while the total stock of housing is valued at around $43.4 trillion.
-
Is the real estate industry growing?
The real estate industry is growing, albeit slowly. The industry’s growth is expected to increase by 0.6% in 2026.
However, property values surged significantly from 2021 to 2022, increasing by 14.8%, which is notably higher than the average annual appreciation of 3.8%.
-
Is real estate a concentrated industry?
No, the real estate industry is generally not concentrated. The industry is predominantly diverse and tailored to local markets. While some areas may exhibit higher concentrations, broad generalizations are not applicable.
It’s important to note that REITs benefit from concentration and may skew perceptions of industry concentration.
-
Is it hard to be successful in real estate?
Yes, success in real estate can be challenging. With 87% of agents failing within their first five years, it’s crucial to find clients and build a reputation in a competitive field with more than 1.46 million agents.
A strong initial interview with potential clients is vital, as 75% of buyers opt for the first agent they meet. Building a solid client base over time can enhance chances of success due to referrals from satisfied clients.
-
Why do most realtors fail?
Many realtors fail due to a lack of perseverance, ineffective marketing strategies, or insufficient interpersonal skills. Real estate can be perceived as an attractive side gig, but it demands considerable time and effort to establish a successful career.
Some agents may struggle to weather market fluctuations or lack the financial resources needed to sustain themselves during lean periods.
Additionally, the inability to effectively market properties or themselves can lead to lost opportunities and diminished reputations.
-
What is the highest-paying job in real estate?
The highest-paying position in real estate is that of a mortgage loan officer. These professionals assist homebuyers in securing loans for purchasing property.
Mortgage loan officers typically work independently, offering various loan options to clients. With an average salary of $152,639, this career path is financially rewarding.
Other high-paying roles in real estate include:
-
Realtor
-
Property Accountant
-
Real Estate Investment Consultant
Conclusion
The real estate market continues to experience upward price trends, with an overall increase of over 15% since 2021. This trend indicates a stabilizing market, which is promising for millennials, who now represent 37% of the real estate landscape.
While the pandemic significantly impacted the market, with a documented shortage of over 5 million new homes, many traditionally competitive markets, such as Manhattan and Los Angeles, have shifted towards a buyer’s market. Conversely, states like Nebraska, Kansas, Texas, and Idaho are witnessing an influx of buyers.
This migration away from larger U.S. cities can be partially attributed to the rise of remote work, although the long-term sustainability of this trend remains uncertain.
Sources:
-
CNBC. “The typical home price is up a record 13.2% compared to last year, according to Zillow.” Accessed on October 31st, 2021.
-
Statista. “Total home sales in the United States from 2011 to 2020 with a forecast for 2021 and 2022.” Accessed on November 1st, 2021.
-
Rocket Mortgage. “Most Expensive Cities In The US.” Accessed on November 1st, 2021.
-
Rocket Mortgage. “Best Real Estate Markets in 2021.” Accessed on November 1st, 2021.
-
Insurify. “Listed, Listed, Sold! States with the Most Competitive Real Estate Markets.” Accessed on November 1st, 2021.
-
IBISWorld. “Real Estate Sales Brokerage in the US – Market Size 2002–2027.” Accessed on November 1st, 2021.
-
Realtor.com. “Category Archives: Housing Supply.” Accessed on November 1st, 2021.
-
Nareit. “REITs by the Numbers.” Accessed on November 1st, 2021.
-
Statista. “Number of housing units in the United States from 1975 to 2020.” Accessed on November 1st, 2021.
-
The Ascent. “Average Down Payment on a House 2021: $27,850.” Accessed on November 1st, 2021.
-
World Population Review. “Median Home Price By State 2021.” Accessed on November 1st, 2021.
-
Statista. “Average sales price of new homes sold in the United States from 1965 to 2021.” Accessed on November 1st, 2021.
-
Bankrite. “How long does it take to buy a house?” Accessed on November 1st, 2021.
-
FRED. “Housing Inventory Estimate: Vacant Housing Units in the United States.” Accessed on November 1st, 2021.
-
Statista. “Number of National Association of Realtors members in the United States from 2009 to 2020.” Accessed on November 1st, 2021.
-
Zippia. “Best States for a Real Estate Agent To Live and Work in 2021.” Accessed on November 1st, 2021.
-
Bankrite. “How do Realtors get paid?” Accessed on November 1st, 2021.
-
ClubWealth. “Why 87% of Real Estate Agents Fail in the First 5 Years.” Accessed on November 1st, 2021.
-
National Association of Realtors. “2019 Profile of Home Buyers and Sellers.” Accessed on November 1st, 2021.
-
Millionacres. “What Is the Average Appreciation of Real Estate in the U.S.?” Accessed on November 2nd, 2021.
-
Cision. “Global Real Estate Market Report 2021: Market is Expected to Grow from $2687.35 Billion in 2020 to $3717.03 Billion in 2025 – Forecast to 2030.” Accessed on November 2nd, 2021.
-
National Association of Realtors. “2021 Home Buyers and Sellers Generational Trends Report.” Accessed on November 2nd, 2021.
-
Realtor.com. “How Many Homes Will It Take to Find ‘The One’?” Accessed on November 2nd, 2021.
-
The New York Times. “Online Home Buying by Generation.” Accessed on November 2nd, 2021.
-
Millionacres. “Americans Spend This Much of Their Paychecks on Housing: How Do You Compare?” Accessed on November 2nd, 2021.
-
National Association of Realtors. “Highlights From the Profile of Home Buyers and Sellers.” Accessed on November 2nd, 2021.
-
NAHB. “Characteristics of New and First-Time Home Buyers.” Accessed on November 2nd, 2021.
-
IBISWorld. “Real Estate Sales & Brokerage in the US – Market Size 2005-2029.” Accessed on March 13th, 2023.
-
Statista. “Number of existing homes sold in the United States from 2005 to 2023.” Accessed on March 13th, 2023.
- Industry Statistics
- Wedding Industry Statistics
- Yoga Industry Statistics
- Music Industry Statistics
- Landscaping Industry Statistics
- Bicycle Industry Statistics
- Coffee Industry Statistics
- Car Rental Industry Statistics
- Home Improvement Industry Statistics
- Insurance Industry Statistics
- Supplements Industry Statistics
- Golf Industry Statistics
- Fitness Industry Statistics
- US Media And Entertainment Industry Statistics
- Firearm Industry Statistics
- Financial Services Industry Statistics
- Health And Wellness Industry Statistics
- Trucking Industry Statistics
- Wine Industry Statistics
- Pet Industry Statistics
- Mobile App Industry Statistics
- Digital Marketing Industry Statistics
- Hotel Industry Statistics
- Retail Statistics
- Robotics Industry Statistics
- Jewelry Industry Statistics
- Appointment Scheduling statistics
- Restaurant Industry Statistics
- Food Delivery Statistics
- Food Truck Industry
- Fashion Industry
- Real Estate Industry
- US Film Industry
- US Beverage Industry
- USu202fFast Food Restaurants
- US Construction Industry
- US Book Industry
- Cosmetics Industry
- US Food Retail Industry
- US Pharmaceutical Industry
- US Healthcare Industry
- Airline Industry
- Automobile Industry
- Transportation Industry Statistics
- Event Industry Statistics
- Project Management Statistics
- Oil And Gas Industry Statistics
- Nursing Home Statistics
- Nursing Shortage Statistics
- Nursing Statistics
Author
Jack Flynn is a writer for Zippia. In his professional career he’s written over 100 research papers, articles and blog posts. Some of his most popular published works include his writing about economic terms and research into job classifications. Jack received his BS from Hampshire College.