Find a Job You Really Want In
Are you gearing up for a job search in 2026?
If so, you may be wondering about the current job market landscape in your area or how it compares to other cities in Ohio. Job markets can vary significantly within the same state; securing an interview in one location may be relatively easy, while it could be a challenge in another.
At Zippia, we value data-driven insights, so we analyzed the latest information to uncover the best job markets in Ohio.
Here are the ten hottest job markets in Ohio for 2026.
The 10 Hottest Job Markets In Ohio
These ten locations represent the best opportunities for job seekers in Ohio as we move into 2026. Continue reading for an in-depth analysis of how these rankings were determined. If your city isn’t listed in the top 10, please scroll down to see its overall ranking.
How We Determined the Best Job Markets in Ohio
We utilized the most recent data from the Census American Community Survey to analyze key metrics for Ohio’s metropolitan areas. We focused on cities with a civilian workforce exceeding 5,000.
While the unemployment rate is a critical indicator of local job health, it’s just one of many factors that contribute to the complexity of job markets. Thus, we took a comprehensive approach to evaluate the job markets across Ohio.
Each metropolitan area was ranked from 1 to 166 across four key categories:
- Unemployment Rate
- Change in Unemployment Rate
- Household Income Change
- Current Average Household Income
A lower score in each category indicates a stronger job market. For example, Bay Village boasts the lowest unemployment rate at 2.36%, securing its position as the top-ranked area. The scores across the four categories were then averaged to create our final ranking of the 166 metro areas, with a lower score indicating a more favorable job market.
1. Bay Village

Unemployment Rate: 2.36%
Average Income: $137,083
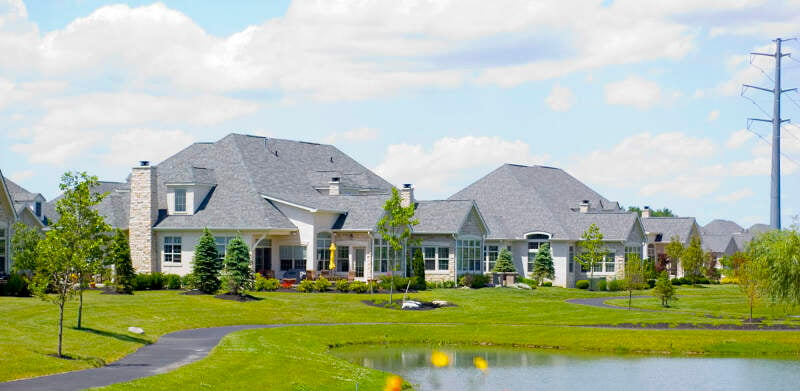
2. Aurora

Unemployment Rate: 3.23%
Average Income: $122,786
3. Avon Lake

Unemployment Rate: 2.45%
Average Income: $114,610
4. Beachwood
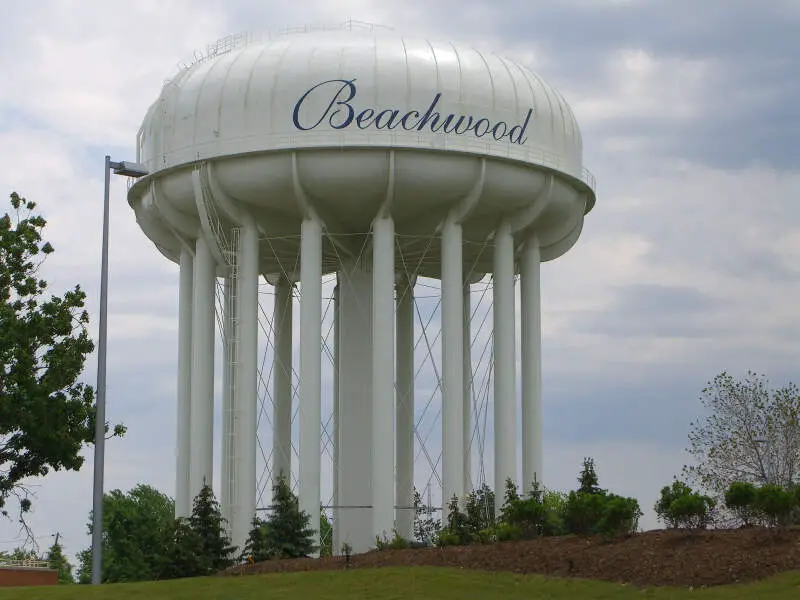
Unemployment Rate: 2.71%
Average Income: $132,541
5. Powell
Unemployment Rate: 3.88%
Average Income: $175,374
6. Broadview Heights
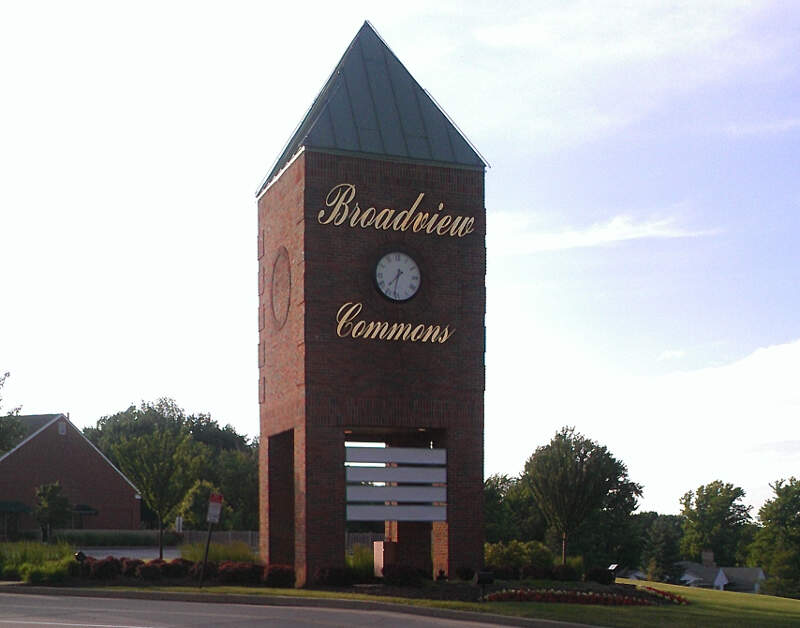
Unemployment Rate: 2.65%
Average Income: $119,483
7. Hudson
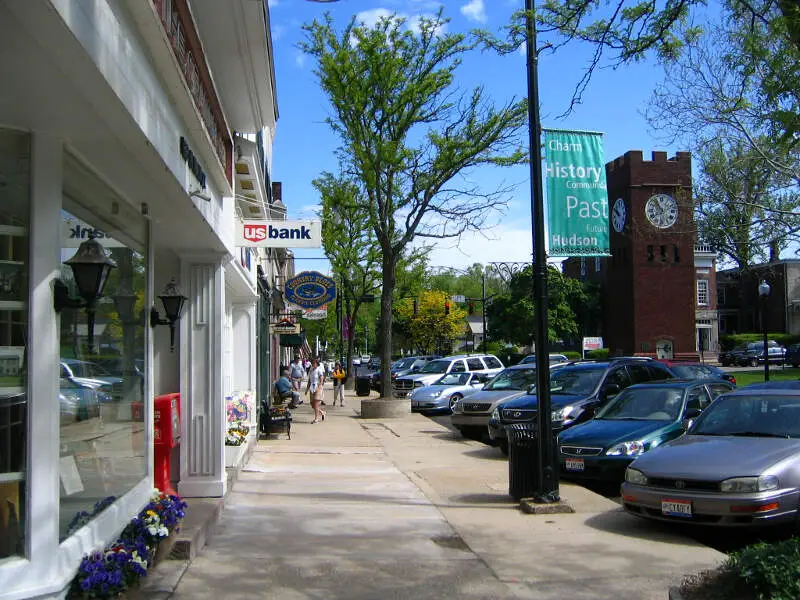
Unemployment Rate: 3.78%
Average Income: $167,699
8. New Albany
Unemployment Rate: 3.85%
Average Income: $264,639
9. Bexley
Unemployment Rate: 4.1%
Average Income: $148,157
10. Dublin

Unemployment Rate: 3.11%
Average Income: $174,805
Measuring the Best Job Markets in Ohio
You might be thinking, ‘Hey, I live in Sharonville and have been struggling to find work—this can’t be right!’ That’s a valid concern.
While Sharonville and its surrounding area is currently considered to have a robust job market, personal circumstances like education, work experience, and occupation significantly impact job search outcomes. Overall, job seekers in Sharonville are likely to have better opportunities than those in cities ranked lower on the list.
Detailed List of the Hottest Job Markets in Ohio
| Rank | Place | Unemployment Rate |
|---|---|---|
| 1 | Bay Village | 2.36% |
| 2 | Aurora | 3.23% |
| 3 | Avon Lake | 2.45% |
| 4 | Beachwood | 2.71% |
| 5 | Powell | 3.88% |
| 6 | Broadview Heights | 2.65% |
| 7 | Hudson | 3.78% |
| 8 | New Albany | 3.85% |
| 9 | Bexley | 4.1% |
| 10 | Dublin | 3.11% |
| 11 | Worthington | 2.23% |
| 12 | Solon | 2.26% |
| 13 | Upper Arlington | 3.02% |
| 14 | Maumee | 3.43% |
| 15 | Lyndhurst | 4.37% |
| 16 | Mason | 1.96% |
| 17 | Monroe | 3.16% |
| 18 | Tipp | 2.03% |
| 19 | Beavercreek | 3.05% |
| 20 | North Royalton | 3.56% |
| 21 | Shaker Heights | 6.11% |
| 22 | Hilliard | 3.43% |
| 23 | Grove | 3.04% |
| 24 | Medina | 2.98% |
| 25 | Westerville | 4.12% |
| 26 | North Ridgeville | 4.15% |
| 27 | Loveland | 2.96% |
| 28 | Gahanna | 3.3% |
| 29 | Centerville | 2.7% |
| 30 | Pickerington | 4.21% |
| 31 | Strongsville | 4.69% |
| 32 | Perrysburg | 3.06% |
| 33 | University Heights | 4.11% |
| 34 | Blue Ash | 3.08% |
| 35 | Delaware | 3.25% |
| 36 | North Canton | 3.25% |
| 37 | Willoughby | 3.69% |
| 38 | Green | 3.61% |
| 39 | Springboro | 4.13% |
| 40 | Streetsboro | 4.48% |
| 41 | Brunswick | 3.21% |
| 42 | Springdale | 6.22% |
| 43 | Wickliffe | 5.17% |
| 44 | Stow | 3.1% |
| 45 | Willoughby Hills | 3.66% |
| 46 | Amherst | 6.87% |
| 47 | Fairview Park | 4.49% |
| 48 | Norwood | 5.04% |
| 49 | Mayfield Heights | 6.63% |
| 50 | Fairfield | 4.05% |
| 51 | Westlake | 3.9% |
| 52 | Mentor | 3.77% |
| 53 | Columbus | 5.78% |
| 54 | Clayton | 5.13% |
| 55 | Troy | 5.85% |
| 56 | Heath | 3.69% |
| 57 | Trenton | 4.72% |
| 58 | Twinsburg | 3.24% |
| 59 | Sharonville | 0.97% |
| 60 | Brooklyn | 8.26% |
| 61 | Findlay | 5.26% |
| 62 | Brecksville | 5.68% |
| 63 | Forest Park | 4.16% |
| 64 | Wadsworth | 3.65% |
| 65 | Cleveland Heights | 6.94% |
| 66 | Rocky River | 3.31% |
| 67 | Vandalia | 2.95% |
| 68 | Wooster | 5.5% |
| 69 | Avon | 3.48% |
| 70 | Lancaster | 6.11% |
| 71 | Dover | 4.43% |
| 72 | Lebanon | 3.51% |
| 73 | Macedonia | 2.28% |
| 74 | Reading | 6.0% |
| 75 | Seven Hills | 5.03% |
| 76 | Chillicothe | 6.45% |
| 77 | Kettering | 4.38% |
| 78 | Wilmington | 8.0% |
| 79 | Miamisburg | 4.69% |
| 80 | Pataskala | 4.34% |
| 81 | Harrison | 3.82% |
| 82 | Defiance | 5.63% |
| 83 | Tallmadge | 4.91% |
| 84 | Sylvania | 4.32% |
| 85 | Marysville | 2.34% |
| 86 | Cuyahoga Falls | 3.79% |
| 87 | Reynoldsburg | 4.62% |
| 88 | Huber Heights | 5.52% |
| 89 | Mount Vernon | 7.29% |
| 90 | New Franklin | 4.74% |
| 91 | Oregon | 6.3% |
| 92 | Parma | 5.69% |
| 93 | Norton | 5.07% |
| 94 | Eastlake | 5.18% |
| 95 | Bellefontaine | 6.38% |
| 96 | Berea | 4.33% |
| 97 | Middleburg Heights | 4.41% |
| 98 | North Olmsted | 4.42% |
| 99 | Washington Court House | 6.08% |
| 100 | Fostoria | 8.24% |
Author
Kathy is the head of content at Zippia with a knack for engaging audiences. Prior to joining Zippia, Kathy worked at Gateway Blend growing audiences across diverse brands. She graduated from Troy University with a degree in Social Science Education.


