Find a Job You Really Want In
In recent months, the job market has continued to evolve, transitioning from the immediate impacts of the COVID-19 pandemic to a more stable economic environment. As we head into 2026, many job seekers are keen to understand which states are experiencing the most robust hiring trends related to the ongoing recovery and adaptation to new workplace norms.
While the pandemic led to significant job losses, certain sectors have rebounded and even expanded, creating new opportunities across various states. Let’s explore which states are leading the way in job creation and what types of positions are emerging in this new landscape.
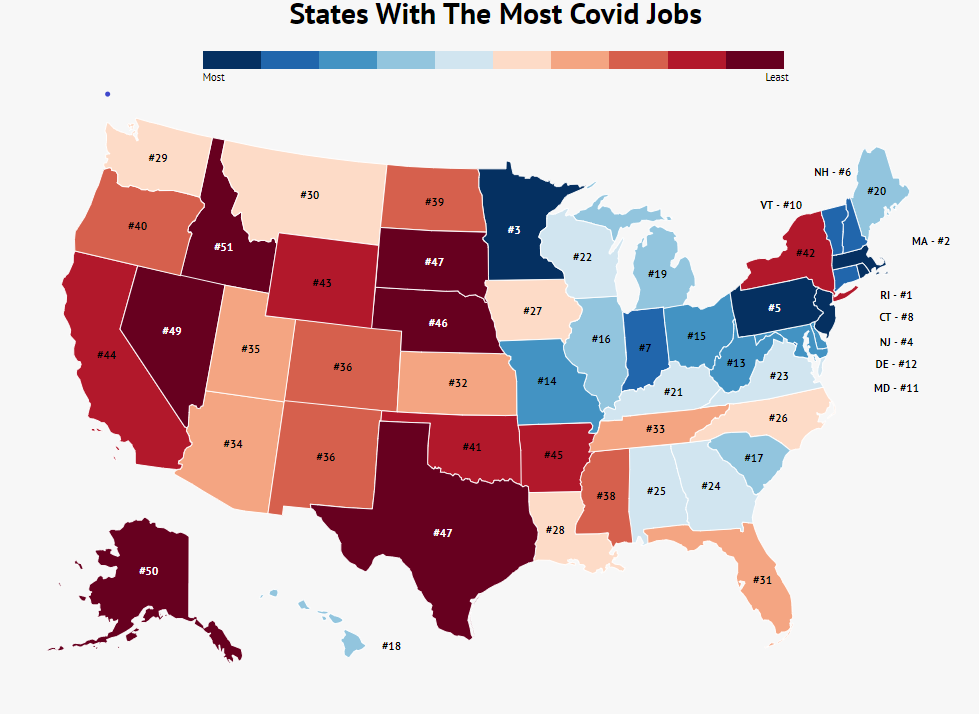
States With The Most COVID-Related Jobs
- Rhode Island
- Massachusetts
- Minnesota
- New Jersey
- Pennsylvania
- New Hampshire
- Indiana
- Connecticut
- District of Columbia
- Vermont
These states have emerged as hubs for job opportunities in sectors that have adapted post-pandemic. As we dive deeper, we’ll examine the types of jobs being created and how job seekers can position themselves for success.
How We Determined The States With The Most COVID-Related Hirings
Our analysis utilized extensive website data, examining more than three million job listings to identify those specifically related to the pandemic. Listings that included keywords such as “COVID” or “coronavirus” were categorized as COVID-related jobs.
Examples of the job categories we analyzed include:
Registered Nurse
Custodian
We then sorted the data by state and calculated the number of jobs per capita, revealing hiring trends across different regions. The higher the jobs per capita, the more significant the COVID-related hiring surge.
1. Rhode Island

Population: 1,059,361
Job Count: 489
Jobs Per 10k People: 4.61
Rhode Island leads with 489 COVID-related job listings, translating to 4.61 jobs per 10,000 residents, signaling a significant opportunity for job seekers.
2. Massachusetts

Population: 6,949,503
Job Count: 2,573
Jobs Per 10k People: 3.7
Massachusetts offers 2,573 COVID-related positions, equating to 3.7 jobs for every 10,000 individuals. It’s a prime time to update your resume and explore opportunities.
3. Minnesota

Population: 5,639,632
Job Count: 1,872
Jobs Per 10k People: 3.31
With 1,872 job openings, Minnesota has a job rate of 3.31 per 10,000 residents, making it a competitive state for job seekers in the COVID-related job market.
4. New Jersey

Population: 8,882,190
Job Count: 2,716
Jobs Per 10k People: 3.05
New Jersey ranks fourth with 2,716 job listings, yielding a rate of 3.05 jobs per 10,000 residents, reflecting ongoing demand in various sectors.
5. Pennsylvania

Population: 12,801,989
Job Count: 3,646
Jobs Per 10k People: 2.84
Pennsylvania boasts 3,646 COVID-related jobs, offering 2.84 positions per 10,000 people, highlighting the state’s recovery efforts.
6. New Hampshire

Population: 1,359,711
Job Count: 365
Jobs Per 10k People: 2.68
New Hampshire ranks sixth with 365 job listings, resulting in 2.68 jobs per 10,000 residents, indicating a steady demand in local sectors.
7. Indiana

Population: 6,732,219
Job Count: 1,796
Jobs Per 10k People: 2.66
Indiana ranks seventh with 1,796 COVID-related jobs, translating to 2.66 jobs per 10,000 people, making it a viable option for job seekers.
8. Connecticut

Population: 3,565,287
Job Count: 919
Jobs Per 10k People: 2.57
Connecticut has 919 job listings available, equating to 2.57 jobs per 10,000 residents, providing further opportunities in the job market.
9. District of Columbia

Population: 705,749
Job Count: 177
Jobs Per 10k People: 2.51
The District of Columbia reports 177 job listings, offering 2.51 positions per 10,000 residents, underscoring the need for job seekers to act quickly.
10. Vermont

Population: 623,989
Job Count: 155
Jobs Per 10k People: 2.48
Vermont concludes our list with 155 COVID-related job listings, resulting in 2.48 jobs per 10,000 residents, encouraging applicants to explore these opportunities.
Most Common COVID-19 Jobs
In analyzing the job market, we identified several common roles that have seen increased demand. These positions include:
- Shift Manager
- Crew Member
- Pharmacist Technician
- Store Associate
- Shift Supervisor
- Department Manager
- Guest Services Leader
- General Manager
- Maintenance Person
- Licensed Practical Nurse
Interestingly, not all job opportunities are healthcare-focused. In addition to healthcare roles like pharmacist techs and LPNs, positions in retail and food service are also on the rise, reflecting changing consumer behavior and preferences.
Summary of the States With the Most COVID-Related Hirings
Although the job market still faces significant challenges, the ongoing recovery highlights new opportunities across various sectors. COVID-19 has transformed the landscape of work, leading to an interesting array of hiring trends.
While certain roles have disappeared, many have emerged to meet the evolving demand in both healthcare and service industries. Although many of these jobs are lower-paying and may not attract every job seeker, they signify an essential part of the recovery process.
The States With The Most (And Least) COVID Jobs
| State | Jobs | Jobs_Per_10K |
|---|---|---|
| Rhode Island | 489 | 4 |
| Massachusetts | 2,573 | 3 |
| Minnesota | 1,872 | 3 |
| New Jersey | 2,716 | 3 |
| Pennsylvania | 3,646 | 2 |
| New Hampshire | 365 | 2 |
| Indiana | 1,796 | 2 |
| Connecticut | 919 | 2 |
| DC | 177 | 2 |
| Vermont | 155 | 2 |
| Maryland | 1,457 | 2 |
| Delaware | 230 | 2 |
| West Virginia | 412 | 2 |
| Missouri | 1,374 | 2 |
| Ohio | 2,573 | 2 |
| Illinois | 2,772 | 2 |
| South Carolina | 1,120 | 2 |
| Hawaii | 298 | 2 |
| Michigan | 2,054 | 2 |
| Maine | 271 | 2 |
| Kentucky | 893 | 2 |
| Wisconsin | 1,163 | 2 |
| Virginia | 1,672 | 1 |
| Georgia | 2,049 | 1 |
| Alabama | 936 | 1 |
| North Carolina | 1,989 | 1 |
| Iowa | 559 | 1 |
| Louisiana | 785 | 1 |
| Washington | 1,222 | 1 |
| Montana | 171 | 1 |
| Florida | 3,414 | 1 |
| Kansas | 456 | 1 |
| Tennessee | 1,062 | 1 |
| Arizona | 1,131 | 1 |
| Utah | 497 | 1 |
| Colorado | 857 | 1 |
| New Mexico | 306 | 1 |
| Mississippi | 434 | 1 |
| North Dakota | 111 | 1 |
| Oregon | 587 | 1 |
| Oklahoma | 548 | 1 |
| New York | 2,694 | 1 |
| Wyoming | 80 | 1 |
| California | 5,322 | 1 |
| Arkansas | 403 | 1 |
| Nebraska | 236 | 1 |
| Texas | 3,503 | 1 |
| South Dakota | 104 | 1 |
| Nevada | 292 | .95 |
| Alaska | 64 | .87 |
| Idaho | 134 | .75 |
Author
Amanda Postma is a writer for the Zippia Career Advice blog with a focus on creating entertaining content to help you through your job search. She received her BA from the University Of Missouri-Columbia.