Find a Job You Really Want In
Ever wondered where in the country people are happiest? Better yet, what cities in your state have the secret sauce for happiness?
Just like where you work and what you do, where you live can have major implications for your quality of life. We set out to find the cities in California where life is sweetest, the wages are high, and people aren’t wasting their lives away in cars,
The results? Happiness comes in small packages.
The result is this list of the best cities for :
- Ladera Ranch, CA
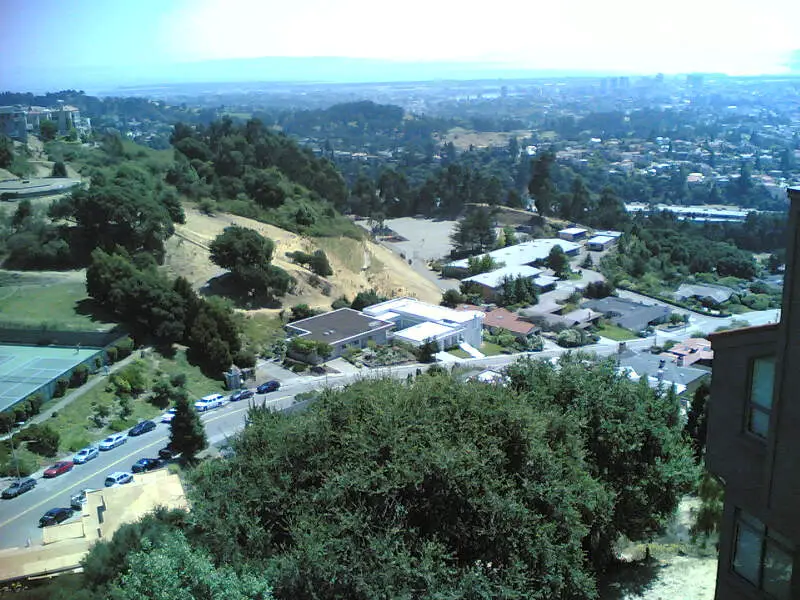
- Piedmont, CA
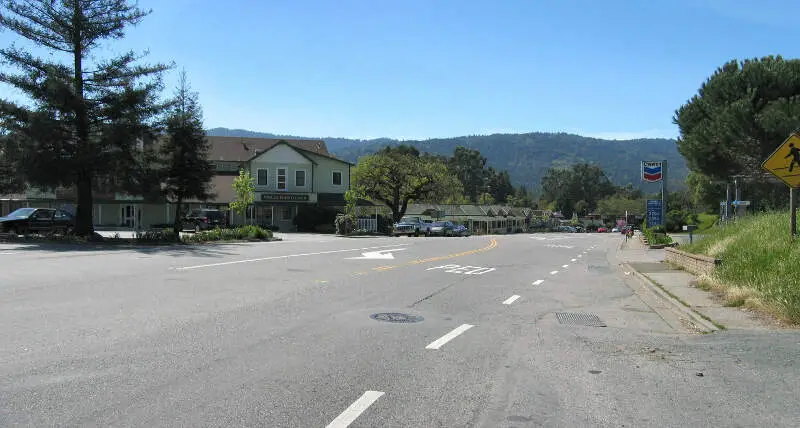
- Woodside, CA
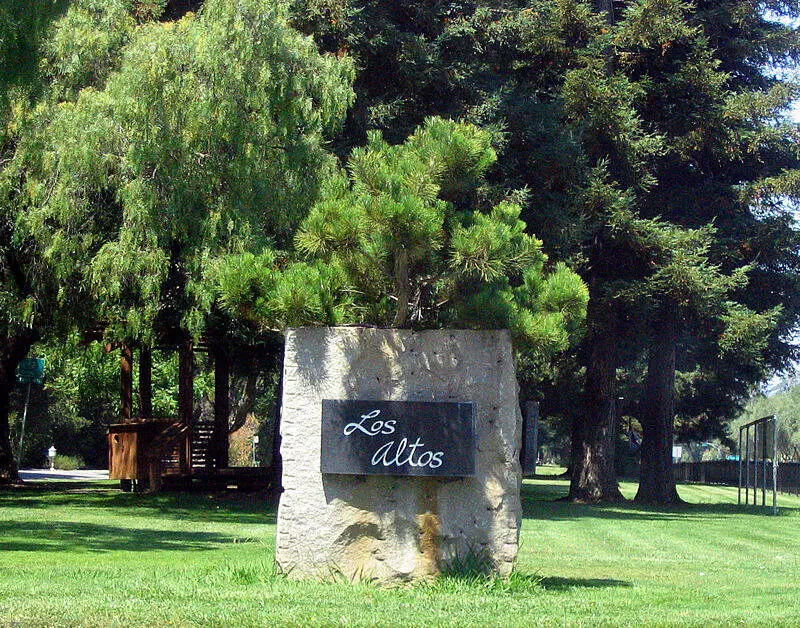
- Los Altos, CA
- Las Flores Cdp (Orange County), CA
- Coto De Caza, CA
- Atherton, CA
- North Tustin, CA
- San Carlos, CA
- Rossmoor, CA
These are the happiest places in California. Keep reading to see what has everyone grinning so much.
How did we determined the happiest places to live in California?
We turned happiness into a science and scoured the state to find the cities with all the ingredients for happiness:
- Being well educated (Population with at least a bachelor’s degree)
- Percent of households earning above $75,000
- Median home prices
- A short commute to work (Traffic = unhappiness)
- Having a family (Getting, and staying married, has a ton of happiness benefits, on average)
We examined over 641 cities, to find the cities that have all of the above in spades.
While some may be confused to see marriage rates included in our metrics, studies show that married people are typically happier than unmarried people. However, it is worth noting that marriage doesn’t cause happiness. In fact, people leaving a bad marriage experience spikes of happiness. However, a happy marriage and positive social interactions are important for mood and mental health.
Similarly, if you’re scratching your head to see $75,000 as the cut-off for happiness, blame Purdue University. Their study found that amount meets basic needs and frees people from the pitfalls of deep financial insecurity that cause unhappiness.
All of our data comes from the most recent American Community Survey.
Keep reading for more on why each of these 10 places is brimming with happiness—or hop to the bottom to see where your city landed on the list.
1. Ladera Ranch
Population: 30,288
Earners Over $75k: 79.8%
Average Commute: 31
Marriage Rate: 28.0%
Ladera Ranch is the happiest city in all of California. What makes Ladera Ranch residents so happy? They aren’t wasting their lives on long commutes for one. The average Ladera Ranch resident only drives 31.8 minuted to work. Toss in affordable housing and the fact that most Ladera Ranch residents are coming home to a loving partner and it’s easy to see the city has a lot going for it.
2. Piedmont
Population: 11,308
Earners Over $75k: 83.9%
Average Commute: 31
Marriage Rate: 30.0%
In 2nd place we have Piedmont. Residents of Piedmont are highly educated, with an impressive 84.0% having at least a bachelor’s degree. And in this modern day, education means options, and folks in Piedmont have plenty of them.
3. Woodside
Population: 5,541
Earners Over $75k: 83.4%
Average Commute: 25
Marriage Rate: 23.0%
Woodside is the third happiest city in California. Why so happy? 23.0% of Woodside residents come home to a partner to share their life burdens. Bonus? Short commutes give them more time to spend with all their loved ones or on hobbies they enjoy.
4. Los Altos
Population: 30,588
Earners Over $75k: 83.0%
Average Commute: 24
Marriage Rate: 16.0%
Folks in Los Altos have a lot to smile about. An impressive 83.0% of Los Altos households earn $75,000 or more. That means families in Los Altos can afford peace of mind.
5. Las Flores Cdp (Orange County)

Population: 5,877
Earners Over $75k: 75.8%
Average Commute: 33
Marriage Rate: 28.0%
Las Flores CDP (Orange County) is the 5th happiest city in the whole state. Las Flores CDP (Orange County) residents’ moods are kept high by reasonable home prices (the median home price in this California city is only $779,600), happy marriages, and short commutes.
6. Coto De Caza
Population: 14,931
Earners Over $75k: 82.2%
Average Commute: 31
Marriage Rate: 27.0%
Looking to relocate? Data says you should give Coto de Caza a second look because it has all the ingredients for happiness. A staggering 82.2% of households earn over 75,000. Toss in high marriage rates and reasonable commutes, and it’s easy to see those who call Coto de Caza home have a lot to be happy about.
7. Atherton
Population: 7,185
Earners Over $75k: 84.5%
Average Commute: 23
Marriage Rate: 16.0%
Atherton is the 7th happiest city. Atherton residents pull in respectable salaries and manage to do it, on average, within 23.0 minutes of their home. They can use all that extra time saved from a long commute to indulge in hobbies they’re passionate about.
8. North Tustin
Population: 24,736
Earners Over $75k: 73.2%
Average Commute: 24
Marriage Rate: 27.0%
North Tustin residents are highly educated with good incomes, decent marriage rates, and reasonable commutes. What’s not to be happy about?
9. San Carlos
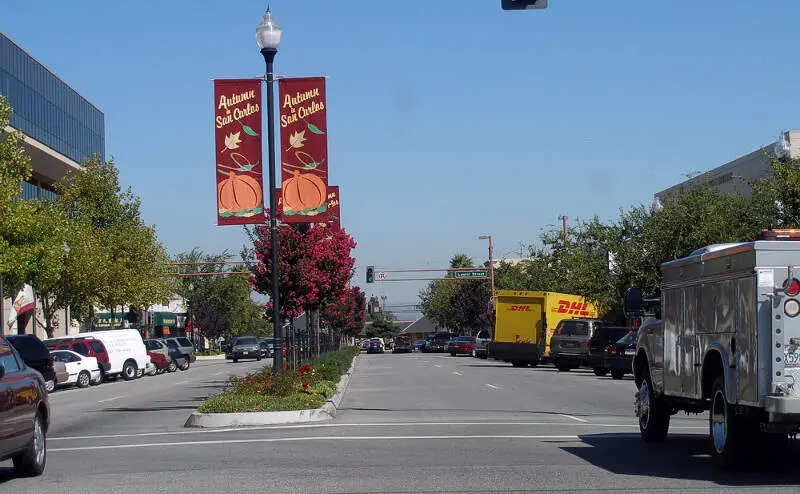
Population: 30,080
Earners Over $75k: 77.3%
Average Commute: 29
Marriage Rate: 24.0%
The 9th happiest city in all of California is San Carlos. The average commute in San Carlos is only 29.2 minutes. That means they are only 29.2 minutes away from the loving spouse 24.0% of them have.
10. Rossmoor
Population: 11,160
Earners Over $75k: 73.2%
Average Commute: 30
Marriage Rate: 31.0%
In 10th place is Rossmoor, California. What makes Rossmoor so great? Affordable housing, reasonable commutes, and healthy incomes. If happiness is contagious, moving here might be worth a try.
And that’s our list of the happiest cities in California
There you have it, happiness is a place.
While we can’t guarantee everyone living and working in the top 10 cities is happy, they have a better chance the most.
If you are looking to improve your own happiness, check out how you can help improve your personal factors: housing costs, job satisfaction, income, and education.
If your city didn’t make the top 10, check out the list below to see whether it missed the cut by a hair or if folks there are struggling to escape despair.
Detailed List Of The Happiest Cities In
| Rank | City | High Earners |
|---|---|---|
| 1 | Ladera Ranch | 79.8% |
| 2 | Piedmont | 83.9% |
| 3 | Woodside | 83.4% |
| 4 | Los Altos | 83.0% |
| 5 | Las Flores Cdp (Orange County) | 75.8% |
| 6 | Coto De Caza | 82.2% |
| 7 | Atherton | 84.5% |
| 8 | North Tustin | 73.2% |
| 9 | San Carlos | 77.3% |
| 10 | Rossmoor | 73.2% |
| 11 | Lafayette | 76.4% |
| 12 | Villa Park | 76.0% |
| 13 | Hillsborough | 87.2% |
| 14 | Danville | 78.5% |
| 15 | Montecito | 74.0% |
| 16 | El Dorado Hills | 75.7% |
| 17 | Rancho Santa Margarita | 69.5% |
| 18 | Rosedale | 65.5% |
| 19 | Truckee | 61.9% |
| 20 | Orinda | 81.3% |
| 21 | Templeton | 53.4% |
| 22 | Rocklin | 62.8% |
| 23 | Manhattan Beach | 75.0% |
| 24 | Granite Bay | 68.5% |
| 25 | Alamo | 83.6% |
| 26 | Cupertino | 77.6% |
| 27 | Menlo Park | 69.8% |
| 28 | Aliso Viejo | 70.1% |
| 29 | San Marino | 72.8% |
| 30 | Newport Beach | 68.8% |
| 31 | Palo Alto | 73.0% |
| 32 | Windsor | 64.2% |
| 33 | Folsom | 65.7% |
| 34 | Poway | 63.8% |
| 35 | El Granada | 74.6% |
| 36 | Yorba Linda | 72.8% |
| 37 | Belmont | 71.3% |
| 38 | Kentfield | 78.1% |
| 39 | Moorpark | 68.4% |
| 40 | San Ramon | 78.7% |
| 41 | Soquel | 57.9% |
| 42 | San Anselmo | 73.9% |
| 43 | Oak Park | 73.0% |
| 44 | Blackhawk | 87.8% |
| 45 | Agoura Hills | 71.7% |
| 46 | El Segundo | 60.6% |
| 47 | Pleasanton | 77.3% |
| 48 | Rolling Hills Estates | 76.0% |
| 49 | Saranap | 72.2% |
| 50 | Westlake Village | 74.1% |
| 51 | Encinitas | 63.9% |
| 52 | Los Altos Hills | 85.9% |
| 53 | Lucas Valley-Marinwood | 71.0% |
| 54 | Del Aire | 59.9% |
| 55 | Saratoga | 78.2% |
| 56 | Burlingame | 69.9% |
| 57 | Scotts Valley | 65.2% |
| 58 | Tiburon | 78.0% |
| 59 | Castaic | 71.9% |
| 60 | Laguna Beach | 70.7% |
| 61 | Los Gatos | 72.9% |
| 62 | Rio Del Mar | 63.5% |
| 63 | Palos Verdes Estates | 79.4% |
| 64 | Campbell | 68.9% |
| 65 | Carlsbad | 66.2% |
| 66 | Goleta | 57.7% |
| 67 | Healdsburg | 57.2% |
| 68 | Lake Forest | 63.7% |
| 69 | Moraga | 75.0% |
| 70 | Sunnyvale | 71.6% |
| 71 | Morgan Hill | 66.6% |
| 72 | Clayton | 80.9% |
| 73 | Coronado | 63.6% |
| 74 | Eucalyptus Hills | 57.2% |
| 75 | Thousand Oaks | 65.4% |
| 76 | Pacific Grove | 53.9% |
| 77 | Livermore | 68.7% |
| 78 | Dublin | 79.7% |
| 79 | Stevenson Ranch | 75.1% |
| 80 | Mountain House | 87.1% |
| 81 | Corte Madera | 75.0% |
| 82 | Tamalpais-Homestead Valley | 77.8% |
| 83 | Santa Clara | 67.4% |
| 84 | San Clemente | 62.7% |
| 85 | Buellton | 59.5% |
| 86 | Mission Viejo | 68.8% |
| 87 | Sierra Madre | 61.0% |
| 88 | Old Fig Garden | 53.4% |
| 89 | Irvine | 62.4% |
| 90 | Los Alamitos | 53.3% |
| 91 | San Juan Capistrano | 56.7% |
| 92 | Live Oak | 53.2% |
| 93 | Orcutt | 57.8% |
| 94 | Placentia | 57.5% |
| 95 | Pismo Beach | 54.8% |
| 96 | El Sobrante Cdp (Riverside County) | 67.8% |
| 97 | Solana Beach | 62.6% |
| 98 | Larkfield-Wikiup | 50.2% |
| 99 | Ripon | 55.3% |
| 100 | Arroyo Grande | 53.8% |
Author
Kathy is the head of content at Zippia with a knack for engaging audiences. Prior to joining Zippia, Kathy worked at Gateway Blend growing audiences across diverse brands. She graduated from Troy University with a degree in Social Science Education.


