The 10 Luckiest States in the U.S. (And The Most Unlucky)
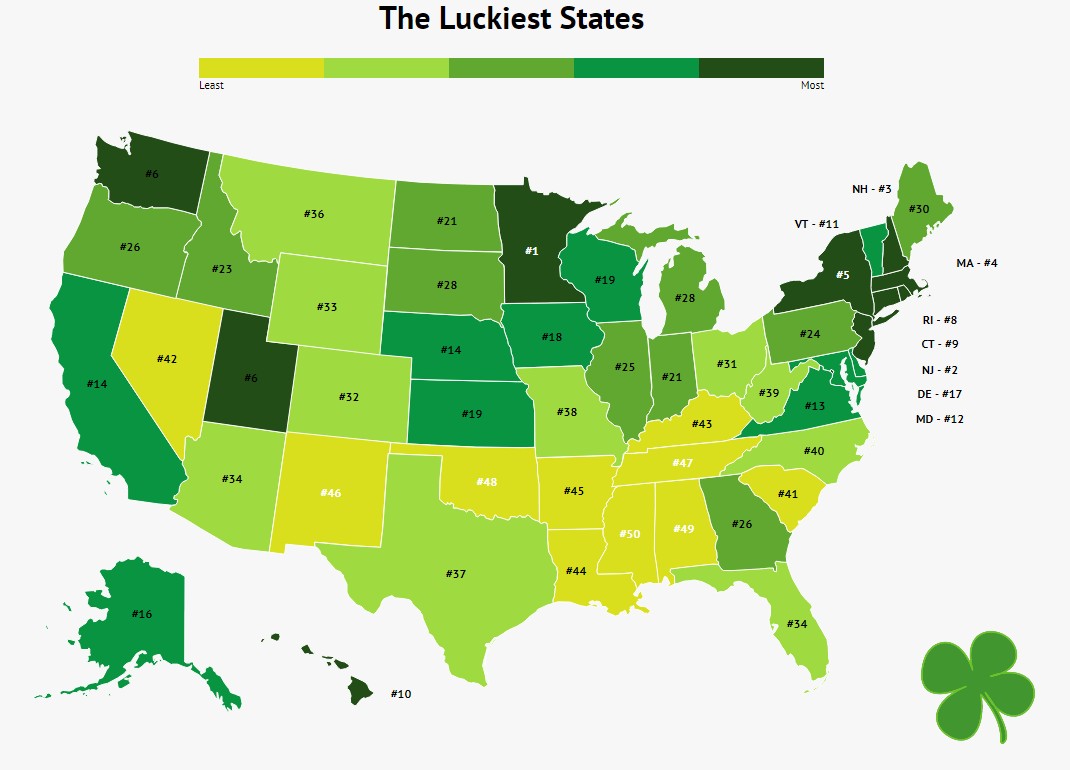
The luckiest state in the U.S. is Minnesota, boasting 22 big lottery winners and an impressive life expectancy of 81 years.
The least lucky state in the U.S. is Mississippi, with 0 big lottery winners and a life expectancy of just 74 years.
The state with the most lottery winners is New York, claiming 50 total winners.
The state with the fewest car accident deaths is Rhode Island, at just 5 deaths per 100K people.
Feeling fortunate? Or perhaps not so much?
It’s undeniable that some individuals seem luckier than others. You know the type—the person who effortlessly earns promotions and consistently wins at office contests.
This leads us to ponder: Are certain regions luckier than others? Are there entire states where lottery tickets yield better outcomes, residents enjoy longer lifespans, and the risk of accidents is notably lower?
To explore this intriguing question, we crunched the numbers to identify the luckiest states in the country, just in time for St. Patrick’s Day.
How We Determined This
We analyzed 6 factors to identify the luckiest states
-
Lotto winners
-
Median Income
-
Low unemployment
-
Average life expectancy
-
Weather-related fatalities
-
Car accident deaths per 100k
We categorized luck into two main aspects: health and finances.
For financial luck, we focused on lottery winnings—after all, it’s hard to beat the thrill of random numbers turning a few bucks into millions. We compiled the number of Powerball and Jackpot wins across states. States without lotteries received the lowest ranking.
Additionally, everyday financial circumstances matter. We examined unemployment rates from BLS data and median household salaries from the ACS. Lower unemployment rates and higher salaries indicate greater luck.
Next, we shifted our focus to health. What is wealth without well-being? We looked at average life expectancy, sourced from the Robert Wood Johnson Foundation.
Accidental deaths, particularly from car accidents, were also considered, as they represent a significant cause of untimely fatalities. The more car accident deaths per 100,000 residents, according to the IIHS, the less fortunate the state.
Similarly, we examined fatalities due to extreme weather events, relying on data from the National Weather Service. Again, higher death rates indicate unluckiness.
All factors were ranked and averaged to reveal the unluckiest states.
1. Minnesota

Big Lotto Winners: 22
Life Expectancy: 81
Car Accident Deaths Per 100k: 7
The luckiest state in the country is Minnesota. Residents enjoy a remarkable life expectancy of 81 years, bolstered by excellent job opportunities and a lower-than-average risk of death from car accidents or extreme weather conditions.
2. New Jersey

Big Lotto Winners: 33
Life Expectancy: 80
Car Accident Deaths Per 100k: 6
When you think of New Jersey, luck might not come to mind. However, it ranks as the second luckiest state in the U.S. Thanks to a high number of lottery winners, strong incomes, and low accident rates, New Jersey has favorable odds.
3. New Hampshire

Big Lotto Winners: 12
Life Expectancy: 80
Car Accident Deaths Per 100k: 7
Being the most Irish state, New Hampshire may indeed enjoy the luck of the Irish, contributing to low unemployment and high incomes.
4. Massachusetts

Big Lotto Winners: 9
Life Expectancy: 81
Car Accident Deaths Per 100k: 5
In fourth place, Massachusetts boasts the lowest rates of extreme weather and car accident fatalities, contributing to its overall luckiness.
5. New York

Big Lotto Winners: 50
Life Expectancy: 81
Car Accident Deaths Per 100k: 5
If you reside in New York, purchasing a lottery ticket is not as risky as it seems. The Empire State has produced a remarkable 50 lottery winners, coupled with low car accident risks, making it a lucky locale.
6. Utah

Big Lotto Winners: 0
Life Expectancy: 80
Car Accident Deaths Per 100k: 8
Despite having no lotteries, Utah remains fortunate with one of the lowest unemployment rates in the nation. For those who have faced job loss, this stability is a significant advantage.
7. Washington

Big Lotto Winners: 6
Life Expectancy: 80
Car Accident Deaths Per 100k: 7
Ranked seventh, Washington experiences only 6.8 car accident deaths per 100,000 residents annually, significantly lower than the national average of 12.
8. Rhode Island

Big Lotto Winners: 9
Life Expectancy: 80
Car Accident Deaths Per 100k: 5
Tiny Rhode Island is rich in luck. Remarkably, no Rhode Islanders died from extreme weather in the examined year, contrasting sharply with the 37 fatalities in Texas.
9. Connecticut

Big Lotto Winners: 8
Life Expectancy: 81
Car Accident Deaths Per 100k: 7
In ninth place, Connecticut offers a high life expectancy and solid incomes, presenting its residents with favorable odds.
10. Hawaii

Big Lotto Winners: 0
Life Expectancy: 82
Car Accident Deaths Per 100k: 8
Living in paradise is already a blessing, but residents of Hawaii enjoy a life expectancy of 82.3 years, the highest in the nation, allowing them to fully embrace their idyllic surroundings.
And Here Are The States That Aren’t So Lucky
Now that you’re familiar with the states where fortune smiles, it’s essential to recognize that not every state enjoys the same luck. Some states face challenges such as lower life expectancies, poor job prospects, and higher risks of car accidents.
Unluckiest States
Unfortunately, these states face considerable challenges.
The majority are located in the South, where economic and health disparities are prevalent. However, there is still hope.
As the philosopher Bruce Springsteen wisely noted, “When it comes to luck, make your own.” You could be just one job application away from landing a position (and salary) that makes you feel incredibly lucky—or perhaps one lottery ticket away from a life-changing win.
While that last option may be less likely, you can find a complete breakdown of all 50 states, from the luckiest to the least lucky, below.
The Most (And Least) Lucky States
| Rank | State | Winners | Life Expectancy | Car Accident Deaths Per 100K | Income |
|---|---|---|---|---|---|
| 1 | Minnesota | 22 | 81 | 6 | $74,593 |
| 2 | New Jersey | 33 | 80 | 6 | $85,751 |
| 3 | New Hampshire | 12 | 80 | 7 | $77,933 |
| 4 | Massachusetts | 9 | 81 | 4 | $85,843 |
| 5 | New York | 50 | 81 | 4 | $72,108 |
| 6 | Utah | 0 | 80 | 8 | $75,780 |
| 7 | Washington | 6 | 80 | 7 | $78,687 |
| 8 | Rhode Island | 9 | 80 | 5 | $71,169 |
| 9 | Connecticut | 8 | 81 | 7 | $78,833 |
| 10 | Hawaii | 0 | 82 | 8 | $83,102 |
| 11 | Vermont | 0 | 79 | 7 | $63,001 |
| 12 | Maryland | 14 | 79 | 8 | $86,738 |
| 13 | Virginia | 10 | 79 | 9 | $76,456 |
| 14 | California | 41 | 81 | 9 | $80,440 |
| 15 | Nebraska | 10 | 79 | 12 | $63,229 |
| 16 | Alaska | 0 | 78 | 9 | $75,463 |
| 17 | Delaware | 10 | 78 | 13 | $70,176 |
| 18 | Iowa | 9 | 79 | 10 | $61,691 |
| 19 | Kansas | 12 | 78 | 14 | $62,087 |
| 20 | Wisconsin | 18 | 79 | 9 | $64,168 |
| 21 | Indiana | 41 | 77 | 12 | $57,603 |
| 22 | North Dakota | 0 | 79 | 13 | $64,577 |
| 23 | Idaho | 6 | 79 | 12 | $60,999 |
| 24 | Pennsylvania | 20 | 78 | 8 | $63,463 |
| 25 | Illinois | 14 | 79 | 8 | $69,187 |
| 26 | Georgia | 23 | 77 | 14 | $61,980 |
| 27 | Oregon | 5 | 79 | 11 | $67,058 |
| 28 | Michigan | 23 | 78 | 9 | $59,584 |
| 29 | South Dakota | 3 | 79 | 11 | $59,533 |
| 30 | Maine | 0 | 78 | 11 | $58,924 |
| 31 | Ohio | 23 | 76 | 9 | $58,642 |
| 32 | Colorado | 3 | 80 | 10 | $77,127 |
| 33 | Wyoming | 0 | 79 | 25 | $65,003 |
| 34 | Arizona | 14 | 79 | 13 | $62,055 |
| 35 | Florida | 16 | 80 | 14 | $59,227 |
| 36 | Montana | 4 | 78 | 17 | $57,153 |
| 37 | Texas | 15 | 79 | 12 | $64,034 |
| 38 | Missouri | 33 | 77 | 14 | $57,409 |
| 39 | West Virginia | 9 | 74 | 14 | $48,850 |
| 40 | North Carolina | 8 | 78 | 13 | $57,341 |
| 41 | South Carolina | 7 | 77 | 19 | $56,227 |
| 42 | Nevada | 0 | 78 | 9 | $63,276 |
| 43 | Kentucky | 18 | 75 | 16 | $52,295 |
| 44 | Louisiana | 17 | 76 | 15 | $51,073 |
| 45 | Arkansas | 2 | 75 | 16 | $48,952 |
| 46 | New Mexico | 5 | 78 | 20 | $51,945 |
| 47 | Tennessee | 8 | 76 | 16 | $56,071 |
| 48 | Oklahoma | 4 | 76 | 16 | $54,449 |
| 49 | Alabama | 0 | 75 | 19 | $51,734 |
| 50 | Mississippi | 0 | 74 | 21 | $45,792 |
Now Try Zippia’s Job Search
Author
Kathy is the head of content at Zippia with a knack for engaging audiences. Prior to joining Zippia, Kathy worked at Gateway Blend growing audiences across diverse brands. She graduated from Troy University with a degree in Social Science Education.