Find a Job You Really Want In
The 10 Hottest Job Markets in Michigan for 2026
Considering a job search in Michigan in 2026? Understanding the current job market landscape is crucial as it can vary significantly from city to city. Some areas may present abundant opportunities, while others can pose challenges in securing an interview. With the ongoing evolution of remote work, technology, and hiring practices, knowing where to focus your efforts can make all the difference.
At Zippia, we analyze labor market data to provide insights into where job seekers might find the most success in Michigan.
Below are the ten hottest job markets in Michigan for 2026.
The 10 Hottest Job Markets in Michigan
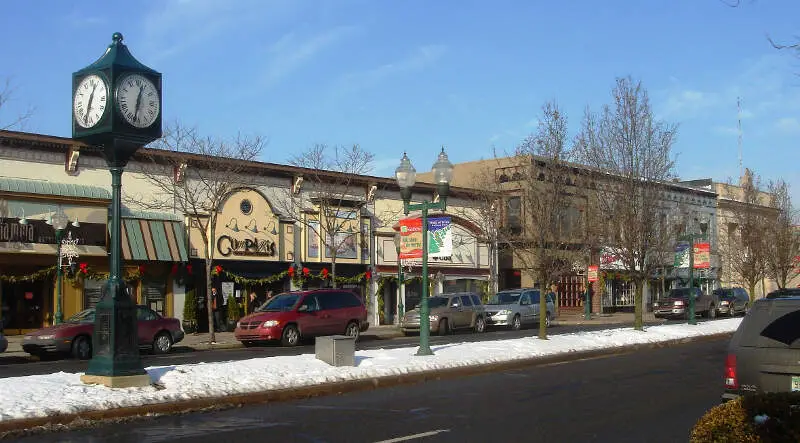
- Birmingham
- Plymouth
- Beverly Hills Village
- Novi
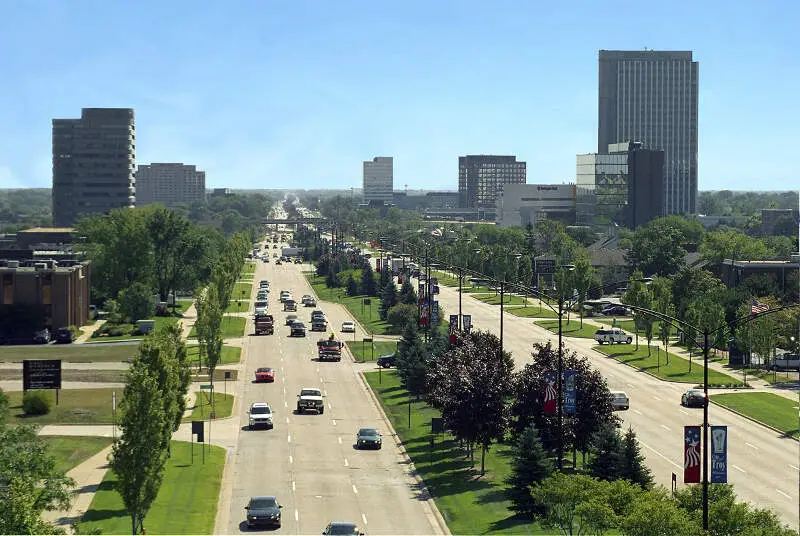
- Troy
- East Grand Rapids
- Royal Oak
- Farmington
- Grosse Pointe Park
- Rochester Hills
These cities represent the best opportunities for job seekers in Michigan. For a deeper understanding of how we compiled this list, keep reading. If your city didn’t make the top 10, continue scrolling to see its ranking.
How We Determined the Best Job Markets in Michigan
We utilized the latest data from the Census American Community Survey to evaluate major metro areas in Michigan, focusing on cities with a civilian working population exceeding 5,000.
While the unemployment rate is an important indicator, it doesn’t provide a complete picture of the job market’s health. Therefore, we conducted a comprehensive analysis of the top job markets in Michigan.
Each metro area was ranked on a scale of 1 to 83 across four categories:
- Unemployment Rate
- Change in Unemployment Rate
- Household Income Change
- Current Average Household Income
A lower score in each category indicates a better performance. For instance, the Birmingham area, with the lowest unemployment rate at 2.68%, secured the top position in that category. The scores across the four categories were averaged to create our final rankings. The metro areas are ranked from 1 to 83, with lower scores reflecting stronger job markets.
1. Birmingham

Unemployment Rate: 2.68%
Average Income: $193,241
2. Plymouth
Unemployment Rate: 3.26%
Average Income: $115,323
3. Beverly Hills Village

Unemployment Rate: 2.81%
Average Income: $159,970
4. Novi

Unemployment Rate: 2.84%
Average Income: $125,042
5. Troy
Unemployment Rate: 3.99%
Average Income: $120,616
6. East Grand Rapids

Unemployment Rate: 2.86%
Average Income: $173,263
7. Royal Oak
Unemployment Rate: 3.61%
Average Income: $98,739
8. Farmington

Unemployment Rate: 3.37%
Average Income: $88,973
9. Grosse Pointe Park

Unemployment Rate: 3.28%
Average Income: $162,769
10. Rochester Hills
Unemployment Rate: 3.28%
Average Income: $116,824
Measuring the Best Job Markets in Michigan
If you’re living in a city with a higher unemployment rate and struggling to find work, it’s important to remember that individual circumstances play a significant role. Factors like education, work experience, and specific job skills can impact your job search, even in a city with a strong job market. Nevertheless, those seeking employment in Birmingham will generally find more opportunities compared to those in cities with lower rankings.
Detailed List of the Hottest Job Markets in Michigan
| Rank | Place | Unemployment Rate |
|---|---|---|
| 1 | Birmingham | 2.68% |
| 2 | Plymouth | 3.26% |
| 3 | Beverly Hills Village | 2.81% |
| 4 | Novi | 2.84% |
| 5 | Troy | 3.99% |
| 6 | East Grand Rapids | 2.86% |
| 7 | Royal Oak | 3.61% |
| 8 | Farmington | 3.37% |
| 9 | Grosse Pointe Park | 3.28% |
| 10 | Rochester Hills | 3.28% |
| 11 | Farmington Hills | 3.94% |
| 12 | Walker | 3.37% |
| 13 | Midland | 5.94% |
| 14 | Wixom | 2.22% |
| 15 | Portage | 4.72% |
| 16 | Trenton | 3.02% |
| 17 | Livonia | 4.48% |
| 18 | Norton Shores | 4.62% |
| 19 | Allen Park | 3.96% |
| 20 | Ann Arbor | 4.6% |
| 21 | Southgate | 5.62% |
| 22 | Riverview | 3.58% |
| 23 | Clawson | 2.88% |
| 24 | Berkley | 2.04% |
| 25 | Rochester | 5.09% |
| 26 | Grandville | 2.68% |
| 27 | South Lyon | 2.74% |
| 28 | Ferndale | 3.41% |
| 29 | Grosse Pointe Woods | 3.47% |
| 30 | Grand Haven | 5.38% |
| 31 | Holland | 4.96% |
| 32 | Fraser | 5.07% |
| 33 | Traverse | 4.9% |
| 34 | Mount Pleasant | 9.14% |
| 35 | Auburn Hills | 6.94% |
| 36 | Madison Heights | 4.94% |
| 37 | Wyoming | 4.85% |
| 38 | Kentwood | 4.13% |
| 39 | St. Clair Shores | 6.1% |
| 40 | Sterling Heights | 4.01% |
| 41 | Monroe | 6.32% |
| 42 | Taylor | 8.79% |
| 43 | New Baltimore | 4.33% |
| 44 | Dearborn | 7.81% |
| 45 | Grand Rapids | 6.81% |
| 46 | Dearborn Heights | 7.28% |
| 47 | Adrian | 6.69% |
| 48 | Woodhaven | 8.11% |
| 49 | Kalamazoo | 9.0% |
| 50 | Fenton | 4.75% |
| 51 | Marquette | 7.14% |
| 52 | Burton | 8.56% |
| 53 | Garden | 3.87% |
| 54 | Warren | 8.43% |
| 55 | Hazel Park | 7.92% |
| 56 | Jackson | 9.15% |
| 57 | Westland | 5.79% |
| 58 | Wayne | 6.64% |
| 59 | Lincoln Park | 9.16% |
| 60 | Lansing | 9.04% |
| 61 | Battle Creek | 8.29% |
| 62 | Southfield | 7.25% |
| 63 | Owosso | 6.51% |
| 64 | Mount Clemens | 8.84% |
| 65 | Eastpointe | 9.37% |
| 66 | Roseville | 7.92% |
| 67 | Bay | 9.35% |
| 68 | Sault Ste. Marie | 8.43% |
| 69 | Wyandotte | 6.1% |
| 70 | Escanaba | 6.46% |
| 71 | Inkster | 12.32% |
| 72 | East Lansing | 9.14% |
| 73 | Oak Park | 6.61% |
| 74 | Detroit | 17.32% |
| 75 | Saginaw | 14.92% |
| 76 | Harper Woods | 11.32% |
| 77 | Port Huron | 11.06% |
| 78 | Romulus | 9.33% |
| 79 | Ypsilanti | 8.83% |
| 80 | Pontiac | 13.29% |
| 81 | Hamtramck | 10.33% |
| 82 | Muskegon | 12.24% |
| 83 | Flint | 20.85% |
In summary, understanding the job markets in Michigan can significantly enhance your job search strategy. The cities listed above offer the best opportunities, but individual circumstances such as skills and experience will also play a crucial role in your success. Whether you’re seeking remote work or traditional roles, targeting these hotspots will increase your chances of finding the right job for you.
Author
Kathy is the head of content at Zippia with a knack for engaging audiences. Prior to joining Zippia, Kathy worked at Gateway Blend growing audiences across diverse brands. She graduated from Troy University with a degree in Social Science Education.


