Find a Job You Really Want In
Tequila Trends in 2026: Which States are Leading the Pack?
As National Tequila Day approaches on July 24, it’s the perfect time to explore which states are raising their glasses the highest. With the celebration of this beloved spirit, we take a closer look at tequila consumption trends across the United States.
It’s time to prepare your limes and salt, or perhaps mix up a delicious margarita! If you have a passion for tequila, chances are you reside in one of the states on our list.
Cheers to those who know how to celebrate! Residents in these states enjoy consuming nearly a full bottle of tequila each year, if not more.
If your state didn’t make the top 10, don’t worry! Continue reading for a comprehensive list of states and their tequila consumption rates.
99 Bottles of Tequila on the Wall
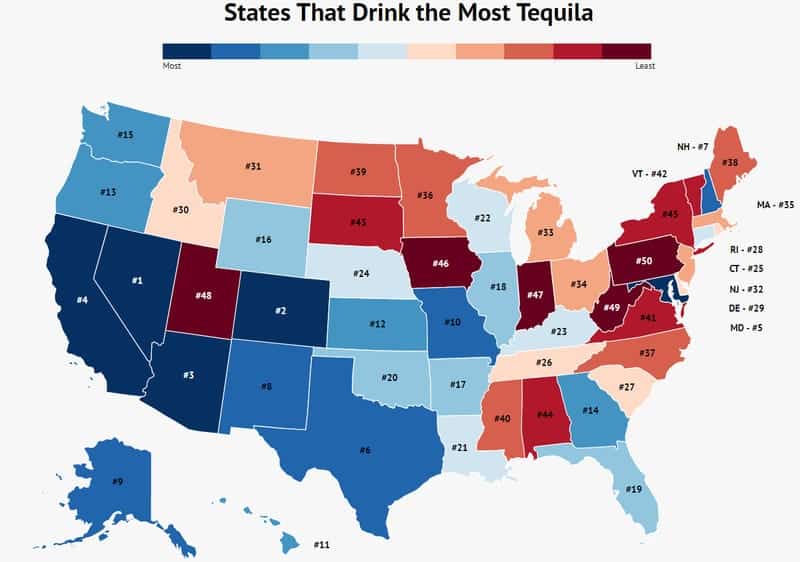
To determine the annual tequila consumption per capita, we analyzed data from Vinepair. The statistics reveal the number of tequila bottles consumed by adults each year across the nation.
The figures for the top 10 states are remarkable, especially considering that not every adult drinks tequila annually. It’s evident that these states celebrate tequila not just on National Tequila Day but throughout the year.
1. Nevada
No. of Tequila Bottles Per Adult: 2.3
The vibrant state of Nevada, home to Las Vegas, tops the list with an impressive 2.3 bottles of tequila consumed per adult each year. It’s easy to see how the saying, “What Happens in Vegas, Stays in Vegas,” became popular!
2. Colorado
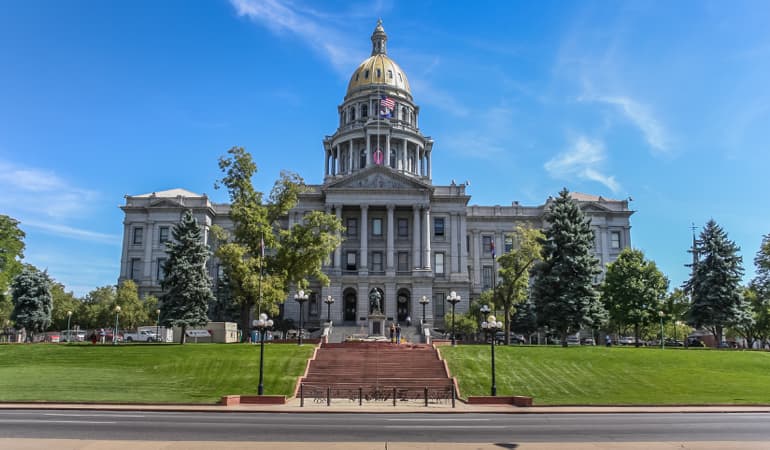
No. of Tequila Bottles Per Adult: 1.4
Beyond the stunning mountain views, Colorado residents enjoy their tequila, with an average consumption of 1.4 bottles per adult each year.
3. Arizona
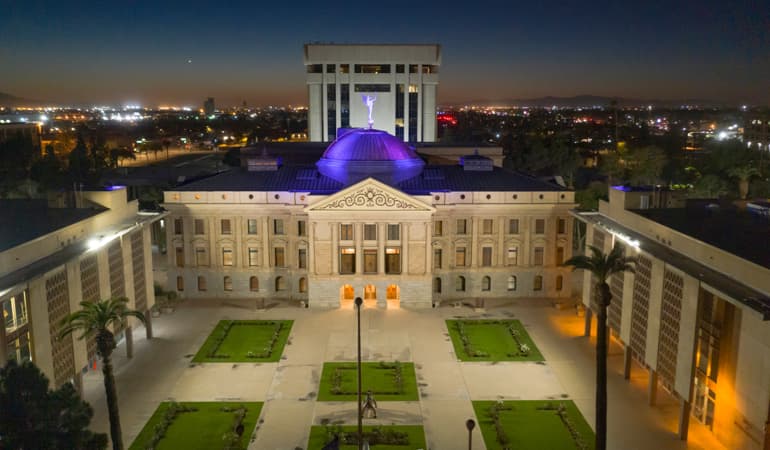
No. of Tequila Bottles Per Adult: 1.4
Arizona comes in third, matching Colorado’s average with 1.4 bottles per adult. The sun-drenched desert seems to pair perfectly with tequila!
4. California
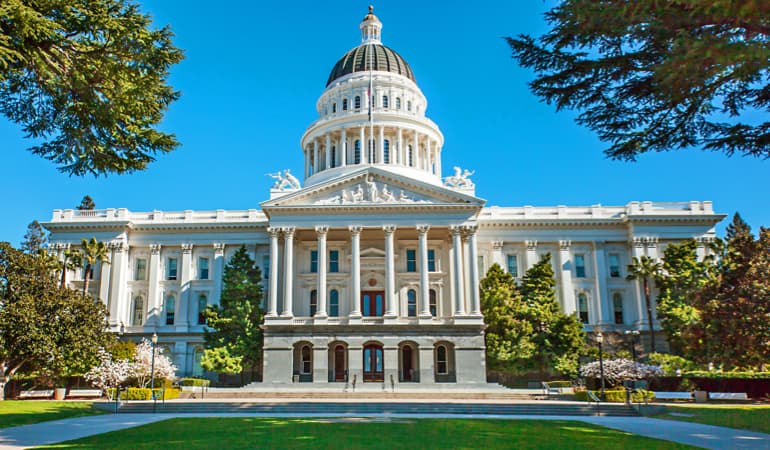
No. of Tequila Bottles Per Adult: 1.3
California ranks fourth, with each adult consuming an average of 1.3 bottles of tequila annually. That’s quite a haul of party bottles!
5. Maryland

No. of Tequila Bottles Per Adult: 1.2
Maryland holds the fifth spot, where each adult reportedly consumes 1.2 bottles of tequila yearly. Proximity to the political hub of Washington, D.C. may contribute to this spirited consumption!
6. Texas

No. of Tequila Bottles Per Adult: 1.2
In Texas, the saying goes, “All My Exes Live in Texas,” and perhaps that’s why the state sees an average consumption of 1.2 bottles per adult!
7. New Hampshire
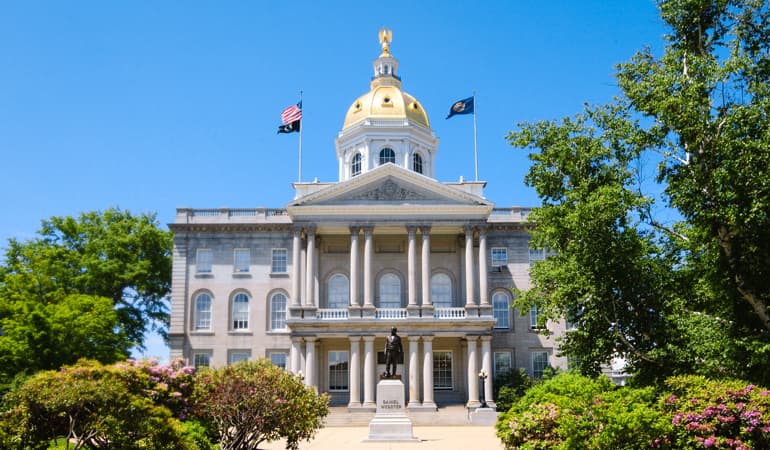
No. of Tequila Bottles Per Adult: 1.2
New Hampshire rounds out the list with an average of 1.2 bottles consumed per adult each year. Perhaps a family of five can make quite the margarita party!
8. New Mexico
No. of Tequila Bottles Per Adult: 1.1
New Mexico residents enjoy 1.1 bottles of tequila per adult yearly, a refreshing way to beat the heat!
9. Alaska

No. of Tequila Bottles Per Adult: 1.1
In Alaska, where temperatures can drop, residents still enjoy their tequila with an average of 1.1 bottles per adult annually.
10. Missouri

No. of Tequila Bottles Per Adult: 0.8
Missouri, known as the Gateway to the Midwest, places tenth with 0.8 bottles of tequila consumed per adult each year—a great way to lighten the mood!
10 Rounds of Jose Cuervo
In a world filled with challenges, many find solace in a refreshing cocktail. On National Tequila Day, you might raise a glass filled with tequila, garnished with a lime and salt. Whether for celebration or relaxation, tequila can be the perfect companion.
So, if you’re in one of the top tequila-loving states, enjoy your drink and embrace the festivities!
| Rank | State | No. Of Tequila Bottles |
|---|---|---|
| 1 | Nevada | 2.3 |
| 2 | Colorado | 1.42 |
| 3 | Arizona | 1.35 |
| 4 | California | 1.27 |
| 5 | Maryland | 1.2 |
| 6 | Texas | 1.18 |
| 7 | New Hampshire | 1.15 |
| 8 | New Mexico | 1.13 |
| 9 | Alaska | 1.11 |
| 10 | Missouri | 0.81 |
| 11 | Hawaii | 0.81 |
| 12 | Kansas | 0.80 |
| 13 | Oregon | 0.79 |
| 14 | Georgia | 0.77 |
| 15 | Washington | 0.75 |
| 16 | Wyoming | 0.73 |
| 17 | Arkansas | 0.72 |
| 18 | Illinois | 0.7 |
| 19 | Florida | 0.68 |
| 20 | Oklahoma | 0.67 |
| 21 | Louisiana | 0.66 |
| 22 | Wisconsin | 0.65 |
| 23 | Kentucky | 0.64 |
| 24 | Nebraska | 0.62 |
| 25 | Connecticut | 0.61 |
| 26 | Tennessee | 0.59 |
| 27 | South Carolina | 0.58 |
| 28 | Rhode Island | 0.58 |
| 29 | Delaware | 0.55 |
| 30 | Idaho | 0.54 |
| 31 | Montana | 0.54 |
| 32 | New Jersey | 0.54 |
| 33 | Michigan | 0.52 |
| 34 | Ohio | 0.50 |
| 35 | Massachusetts | 0.50 |
| 36 | Minnesota | 0.49 |
| 37 | North Carolina | 0.47 |
| 38 | Maine | 0.47 |
| 39 | North Dakota | 0.46 |
| 40 | Mississippi | 0.46 |
| 41 | Virginia | 0.45 |
| 42 | Vermont | 0.45 |
| 43 | South Dakota | 0.44 |
| 44 | Alabama | 0.44 |
| 45 | New York | 0.43 |
| 46 | Iowa | 0.42 |
| 47 | Indiana | 0.41 |
| 48 | Utah | 0.36 |
| 49 | West Virginia | 0.28 |
| 50 | Pennsylvania | 0.25 |
Explore Job Opportunities on Zippia
Author
Amanda Postma is a writer for the Zippia Career Advice blog with a focus on creating entertaining content to help you through your job search. She received her BA from the University Of Missouri-Columbia.