Find a Job You Really Want In
The 10 Worst Cities for Women in Minnesota in 2026
As we move into 2026, the landscape for women in the United States continues to evolve, yet challenges persist. Women still encounter significant disparities compared to their male counterparts, including wage gaps, underrepresentation in leadership roles, and higher poverty rates. In Minnesota, the differences among cities can be stark.
To provide a clearer picture, we analyzed various metrics to determine which cities in Minnesota are the most challenging for women. Read on to discover the rankings and the factors that contribute to these disparities.
The 10 Worst Cities to Be a Woman in Minnesota
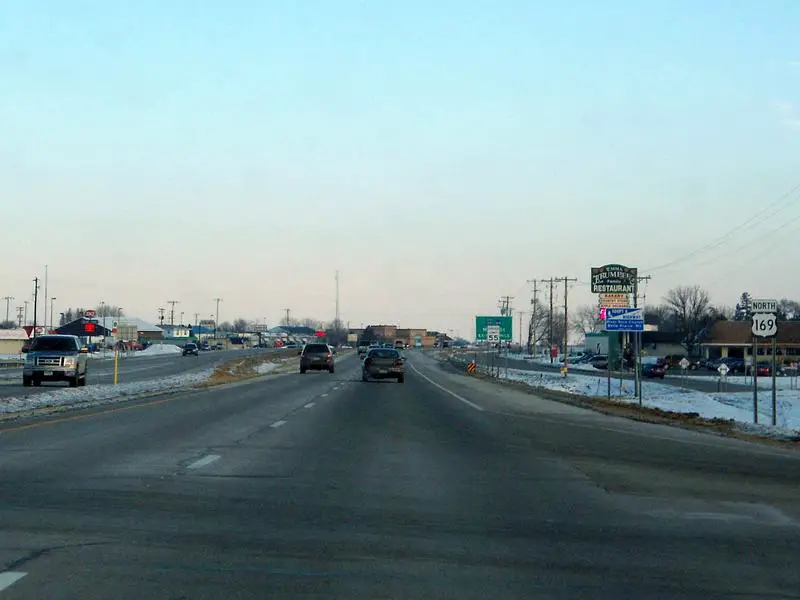
- Glencoe
- Jordan
- Fairmont
- Belle Plaine
- Litchfield
- Moorhead
- Crookston
- North Branch
- Red Wing
- St. Francis
These cities represent the most significant hurdles for women in Minnesota. Continue reading to learn about the specific challenges women face in these locations, or skip to the end to explore the best cities for women in Minnesota.
Methodology – How We Determined the Worst Cities for Women in Minnesota
Each city was evaluated based on four key categories:
- Percentage of Women in Management (Lower is worse)
- Percentage of Women in Poverty (Higher is worse)
- Income earned by women per male dollar earned (Lower is worse)
- Percentage of Uninsured Women (Lower is worse)
We sourced data for the income gap between men and women from the Census’ American Community Survey. By dividing the median male income by median female income, we assessed how much women earn relative to their male counterparts.
To measure the poverty rate for women, we again used data from the ACS. We focused on women living alone, excluding those with relatives, to reflect the economic challenges faced by single women.
The percentage of women in management positions was sourced from the ACS as well, emphasizing the representation of women in leadership roles—a crucial factor for career advancement.
Lastly, we examined the ACS data for the proportion of uninsured women in each city.
Only cities in Minnesota with populations exceeding 5,000 were included in this analysis.
1. Glencoe
Income Earned by Women for Every Male Dollar: $0.58
Women in Management: 28.7%
Women in Poverty: 21.5%
Uninsured Women: 6.2%
Glencoe ranks as the worst city for women in Minnesota, with low scores across all metrics. Women here face a high likelihood of living in poverty and lacking health insurance, making life particularly challenging.
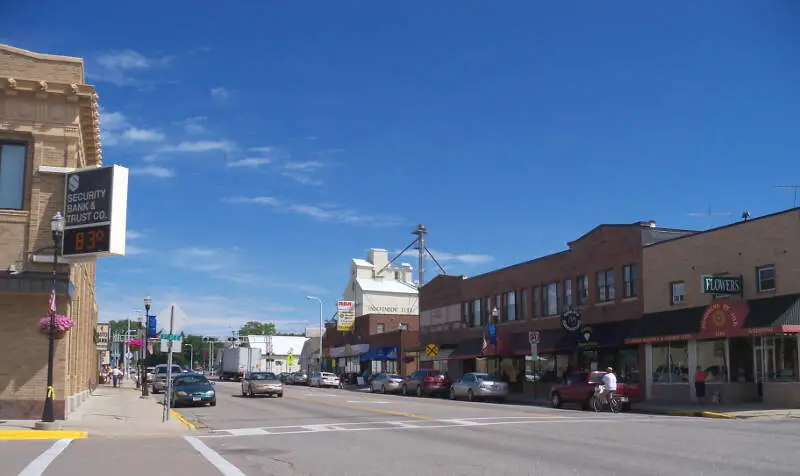
2. Jordan
Income Earned by Women for Every Male Dollar: $0.63
Women in Management: 22.8%
Women in Poverty: 12.5%
Uninsured Women: 9.0%
Jordan comes in as the second-worst city for women, with concerning rates of poverty and representation in management roles.
3. Fairmont

Income Earned by Women for Every Male Dollar: $0.65
Women in Management: 24.7%
Women in Poverty: 18.6%
Uninsured Women: 6.2%
In Fairmont, women face challenges, with only 24.7% holding management positions and 18.6% living in poverty.
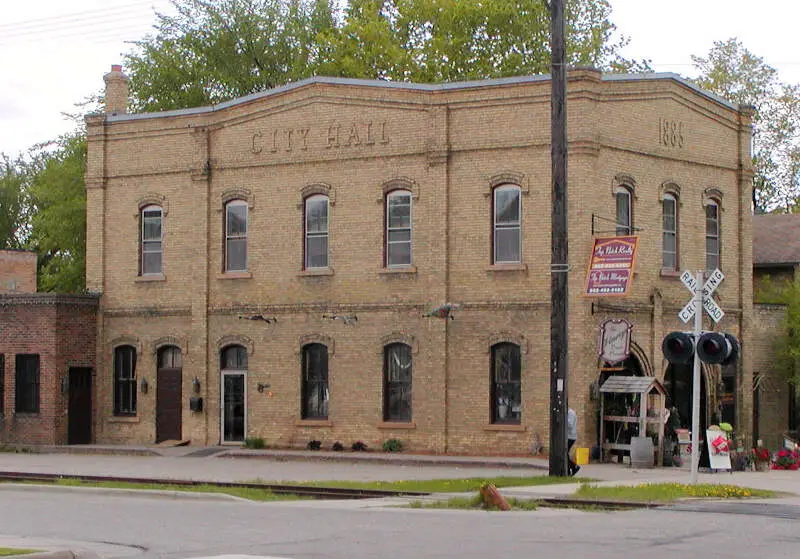
4. Belle Plaine
Income Earned by Women for Every Male Dollar: $0.54
Women in Management: 25.0%
Women in Poverty: 11.6%
Uninsured Women: 4.4%
Belle Plaine ranks fourth for women, with notable percentages of uninsured women and those living in poverty.
5. Litchfield

Income Earned by Women for Every Male Dollar: $0.66
Women in Management: 29.1%
Women in Poverty: 10.7%
Uninsured Women: 6.3%
While Litchfield offers slightly better opportunities, it still falls short in key areas for women.
6. Moorhead

Income Earned by Women for Every Male Dollar: $0.63
Women in Management: 31.8%
Women in Poverty: 16.2%
Uninsured Women: 3.6%
Moorhead ranks sixth, with a significant percentage of women living in poverty despite relatively better management representation.
7. Crookston

Income Earned by Women for Every Male Dollar: $0.68
Women in Management: 36.4%
Women in Poverty: 19.1%
Uninsured Women: 6.1%
In Crookston, women have a relatively better earning ratio, but the high poverty rate remains a concern.
8. North Branch

Income Earned by Women for Every Male Dollar: $0.63
Women in Management: 24.7%
Women in Poverty: 9.2%
Uninsured Women: 4.3%
North Branch shows troubling statistics for women, particularly in income disparity and management representation.
9. Red Wing

Income Earned by Women for Every Male Dollar: $0.66
Women in Management: 36.2%
Women in Poverty: 11.2%
Uninsured Women: 6.6%
Women in Red Wing also grapple with significant income disparities and rates of poverty.
10. St. Francis
Income Earned by Women for Every Male Dollar: $0.60
Women in Management: 27.4%
Women in Poverty: 9.1%
Uninsured Women: 3.8%
St. Francis ranks tenth, indicating that while conditions may be slightly better, challenges remain for women in the workforce.
Summary of the Worst Cities to Be a Woman in Minnesota
The cities listed here represent the most significant barriers for women in Minnesota. While women across the state encounter various challenges, those residing in these cities face particularly adverse conditions.
It’s worth noting that while the disparities are stark, the individual experiences of women can vary widely. Nevertheless, those living in these cities may need to navigate unique obstacles in their pursuit of equity and opportunity.
Detailed List of the Worst Cities for Women in Minnesota
| Rank | Place | Pay Gap |
|---|---|---|
| 1 | Glencoe | $0.58 |
| 2 | Jordan | $0.63 |
| 3 | Fairmont | $0.65 |
| 4 | Belle Plaine | $0.54 |
| 5 | Litchfield | $0.66 |
| 6 | Moorhead | $0.63 |
| 7 | Crookston | $0.68 |
| 8 | North Branch | $0.63 |
| 9 | Red Wing | $0.66 |
| 10 | St. Francis | $0.60 |
| 11 | Mankato | $0.62 |
| 12 | Northfield | $0.35 |
| 13 | Little Falls | $0.75 |
| 14 | Alexandria | $0.64 |
| 15 | Hibbing | $0.64 |
| 16 | Detroit Lakes | $0.69 |
| 17 | Willmar | $0.74 |
| 18 | New Ulm | $0.62 |
| 19 | Virginia | $0.71 |
| 20 | Lake City | $0.65 |
| 21 | Worthington | $0.82 |
| 22 | St. Peter | $0.56 |
| 23 | Fridley | $0.81 |
| 24 | Fergus Falls | $0.75 |
| 25 | Faribault | $0.94 |
| 26 | Bemidji | $0.75 |
| 27 | Winona | $0.72 |
| 28 | White Bear Lake | $0.66 |
| 29 | East Grand Forks | $0.80 |
| 30 | Grand Rapids | $0.65 |
| 31 | St. Cloud | $0.79 |
| 32 | Columbia Heights | $0.83 |
| 33 | Hopkins | $0.67 |
| 34 | Waite Park | $0.68 |
| 35 | Marshall | $0.73 |
| 36 | Morris | $0.39 |
| 37 | Big Lake | $0.63 |
| 38 | Brooklyn Center | $0.77 |
| 39 | Montevideo | $0.71 |
| 40 | Dayton | $0.75 |
| 41 | Waseca | $0.56 |
| 42 | New Hope | $0.71 |
| 43 | Brainerd | $0.73 |
| 44 | Chaska | $0.73 |
| 45 | Austin | $0.72 |
| 46 | Albert Lea | $0.69 |
| 47 | Medina | $0.43 |
| 48 | St. Joseph | $0.22 |
| 49 | Buffalo | $0.57 |
| 50 | Eden Prairie | $0.60 |
| 51 | Edina | $0.58 |
| 52 | Prior Lake | $0.64 |
| 53 | Hermantown | $0.69 |
| 54 | Falcon Heights | $0.47 |
| 55 | New Brighton | $0.76 |
| 56 | Savage | $0.64 |
| 57 | Thief River Falls | $0.73 |
| 58 | International Falls | $0.45 |
| 59 | Orono | $0.62 |
| 60 | Chanhassen | $0.55 |
| 61 | North St. Paul | $0.75 |
| 62 | Lake Elmo | $0.56 |
| 63 | St. Paul | $0.90 |
| 64 | West St. Paul | $0.77 |
| 65 | Shakopee | $0.68 |
| 66 | Owatonna | $0.70 |
| 67 | Victoria | $0.43 |
| 68 | Corcoran | $0.71 |
| 69 | Sauk Rapids | $0.73 |
| 70 | Minneapolis | $0.84 |
| 71 | East Bethel | $0.66 |
| 72 | Hutchinson | $0.67 |
| 73 | Burnsville | $0.77 |
| 74 | Anoka | $0.80 |
| 75 | Minnetrista | $0.56 |
| 76 | Duluth | $0.73 |
| 77 | Isanti | $0.77 |
| 78 | Shorewood | $0.38 |
| 79 | Elk River | $0.70 |
| 80 | Apple Valley | $0.73 |
| 81 | Forest Lake | $0.80 |
| 82 | South St. Paul | $0.79 |
| 83 | Woodbury | $0.61 |
| 84 | Maplewood | $0.83 |
| 85 | Blaine | $0.73 |
| 86 | Ramsey | $0.72 |
| 87 | Maple Grove | $0.66 |
| 88 | Little Canada | $0.79 |
| 89 | Lino Lakes | $0.63 |
| 90 | Otsego | $0.67 |
| 91 | New Prague | $0.72 |
| 92 | Mahtomedi | $0.65 |
| 93 | Rogers | $0.56 |
| 94 | Inver Grove Heights | $0.79 |
| 95 | Waconia | $0.64 |
| 96 | Bloomington | $0.81 |
| 97 | Rochester | $0.81 |
| 98 | Richfield | $0.92 |
| 99 | Brooklyn Park | $0.85 |
| 100 | Baxter | $0.67 |
Author
Kathy is the head of content at Zippia with a knack for engaging audiences. Prior to joining Zippia, Kathy worked at Gateway Blend growing audiences across diverse brands. She graduated from Troy University with a degree in Social Science Education.


