Here Are The Most (And Least) Gun Friendly States in 2026
Summary
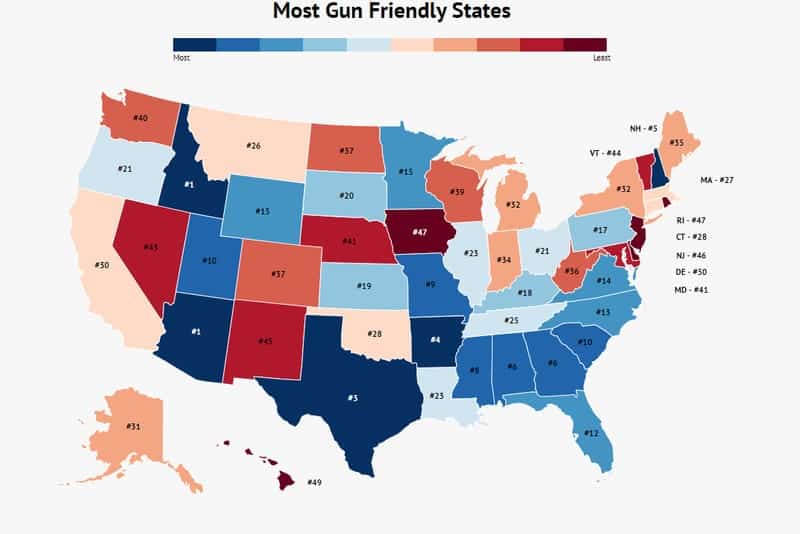
The most gun-friendly state in the United States is Arizona.
The least gun-friendly state in the United States is Delaware.
There are approximately 393 million guns in the United States.
149,146 Americans are employed by the U.S. firearm industry.
The U.S. gun industry pays more than $6.2 billion annually in wages.
The total economic impact of the U.S. gun industry is approximately $21 billion.
For many Americans, firearms represent not just a means of protection but also a significant aspect of cultural heritage. The gun industry is a vital contributor to the economy, providing jobs and generating substantial revenue. As of recent data, there are about 393 million guns in circulation and approximately 149,146 individuals employed in the firearm sector, with an economic impact exceeding $21 billion. These figures underscore the industry’s importance in various states.
Interestingly, not all states experience this economic benefit equally. Numerous states and municipalities impose stringent gun regulations, affecting the local gun economy. This raises the question: which states are the most gun-friendly, and where should job seekers in the firearms industry focus their efforts? We analyzed the data to provide clarity on these issues.
Most 2nd Amendment Friendly States
The Southern and Midwestern states dominate this list, driven by a combination of favorable gun laws, high ownership rates, and robust economic activity in the firearms sector. Continue reading to discover how these states earned their rankings and learn which states are the least gun friendly.
How We Determined These Results
We ranked each state based on:
- Number of firearm jobs
- Average wage of firearm jobs
- Guns per capita
- Gun laws and restrictions
To conduct our analysis, we utilized the latest data from reputable sources, including the Firearms Industry and Trade Report. We ranked each state according to the number of jobs directly linked to the firearm industry, which includes manufacturers, distributors, and retail sellers. We also assessed the average wage for firearm-related jobs, highlighting states that offer better compensation and career opportunities.
Guns per capita figures were sourced from the World Population Review, indicating that higher ownership correlates with a more gun-friendly environment. Lastly, we evaluated each state’s gun laws using data from Gifford’s Law Center, where fewer restrictions indicate greater gun-friendliness. This aspect was weighted more heavily in our rankings.
1. Arizona

Guns Per Capita: 25.61
Gun Friendly Laws: #6
Gun Jobs: 3,476
Average Wage: $51,985
Arizona stands out as the most pro-gun state in the U.S., with a workforce of 3,476 employed in the gun industry, earning an average salary of $51,985. The state also ranks 6th for having lenient gun laws.
2. Idaho

Guns Per Capita: 28.86
Gun Friendly Laws: #2
Gun Jobs: 3,610
Average Wage: $40,937.92
Idaho boasts some of the least restrictive gun laws in the nation, earning its #2 ranking. The state is characterized by its spacious landscapes, making it ideal for hunting and shooting sports.
3. Texas

Guns Per Capita: 20.79
Gun Friendly Laws: #14
Gun Jobs: 11,467
Average Wage: $36,018.78
It’s no surprise that Texas ranks among the top three states. With the highest number of firearm jobs nationwide, Texans take pride in their gun ownership rights and freedoms.
4. Arkansas
Guns Per Capita: 26.57
Gun Friendly Laws: #10
Gun Jobs: 3,101
Average Wage: $40,979.36
Arkansas ranks fourth for its high gun ownership rates, supported by relatively lax gun regulations.
5. New Hampshire

Guns Per Capita: 46.76
Gun Friendly Laws: #21
Gun Jobs: 2,551
Average Wage: $77,343.67
New Hampshire is unique as the only Northeastern state in the top five, recognized for its high gun ownership rates, despite having more restrictions than many in the top ten.
6. Georgia

Guns Per Capita: 18.22
Gun Friendly Laws: #18
Gun Jobs: 4,519
Average Wage: $36,251.47
Georgia is characterized by a strong general support for gun rights, achieving solid rankings across multiple categories.
7. Alabama

Guns Per Capita: 33.15
Gun Friendly Laws: #13
Gun Jobs: 3,105
Average Wage: $35,309.57
In the deep South, Alabama proudly ranks seventh, reflecting its cultural affinity for firearms and gun ownership.
8. Mississippi

Guns Per Capita: 11.89
Gun Friendly Laws: #1
Gun Jobs: 2,324
Average Wage: $41,558.43
Mississippi is not only one of the top states for gun ownership but also boasts the most lenient gun laws, with workers in the firearms sector earning an average of $41,558 annually.
9. Missouri

Guns Per Capita: 11.94
Gun Friendly Laws: #4
Gun Jobs: 5,513
Average Wage: $29,516.38
Missouri, often regarded as both a Southern and Midwestern state, ranks ninth with a robust firearms industry and permissive carry laws.
10. South Carolina

Guns Per Capita: 21.01
Gun Friendly Laws: #20
Gun Jobs: 2,957
Average Wage: $42,023.47
Completing the top ten, South Carolina enjoys a thriving gun industry alongside relatively relaxed gun regulations.
Summary on the Most Gun-Friendly States
The states identified as the most gun-friendly tend to be concentrated in the South and Midwest, characterized by lenient regulations and significant economic activity associated with the firearm industry.
Least Gun Friendly States
Best (And Worst) States For Guns, From Best To Worst
| State | Guns Per Capita | Gun Laws Rank | Gun Jobs | Average Wage |
|---|---|---|---|---|
| Arizona | 25 | 6 | 3,476 | $51,984.81 |
| Idaho | 28 | 2 | 3,610 | $40,937.92 |
| Texas | 20 | 14 | 11,467 | $36,018.78 |
| Arkansas | 26 | 10 | 3,101 | $40,979.36 |
| New Hampshire | 46 | 21 | 2,551 | $77,343.67 |
| Georgia | 18 | 18 | 4,519 | $36,251.47 |
| Alabama | 33 | 13 | 3,105 | $35,309.57 |
| Mississippi | 11 | 1 | 2,324 | $41,558.43 |
| Missouri | 11 | 4 | 5,513 | $29,516.38 |
| South Carolina | 21 | 20 | 2,957 | $42,023.47 |
| Utah | 23 | 24 | 3,108 | $44,615.15 |
| Florida | 16 | 29 | 7,107 | $37,392.43 |
| North Carolina | 14 | 26 | 5,146 | $36,647.10 |
| Virginia | 36 | 25 | 2,806 | $35,150.68 |
| Minnesota | 14 | 38 | 4,757 | $65,399.47 |
| Wyoming | 229 | 2 | 676 | $30,489.20 |
| Pennsylvania | 18 | 39 | 6,107 | $38,746.93 |
| Kentucky | 18 | 4 | 2,069 | $31,238.96 |
| Kansas | 18 | 8 | 2,713 | $27,331.18 |
| South Dakota | 24 | 7 | 1,028 | $32,461.09 |
| Oregon | 14 | 35 | 2,885 | $67,613.10 |
| Ohio | 14 | 26 | 6,407 | $30,281.85 |
| Illinois | 11 | 43 | 5,286 | $57,826.90 |
| Louisiana | 24 | 18 | 2,437 | $29,681.99 |
| Tennessee | 14 | 22 | 3,175 | $34,714.05 |
| Montana | 21 | 14 | 1,427 | $30,712.12 |
| Massachusetts | 5 | 44 | 3,676 | $73,447.91 |
| Connecticut | 22 | 48 | 2,289 | $75,285.41 |
| Oklahoma | 18 | 10 | 2,216 | $25,425.54 |
| California | 8 | 50 | 9,196 | $45,567.88 |
| Alaska | 21 | 9 | 717 | $27,926.36 |
| New York | 3 | 47 | 3,745 | $67,377.36 |
| Michigan | 6 | 31 | 4,230 | $33,724.80 |
| Indiana | 17 | 23 | 3,037 | $25,738.20 |
| Maine | 11 | 14 | 1,376 | $30,924.85 |
| West Virginia | 19 | 14 | 817 | $21,961.93 |
| Colorado | 16 | 37 | 2,471 | $36,536.22 |
| North Dakota | 17 | 12 | 529 | $28,326.47 |
| Wisconsin | 11 | 30 | 2,619 | $34,146.39 |
| Washington | 12 | 41 | 3,688 | $32,900.81 |
| Maryland | 17 | 45 | 1,599 | $57,811.19 |
| Nebraska | 11 | 33 | 1,831 | $37,930.75 |
| Nevada | 25 | 35 | 1,405 | $27,914.23 |
| Vermont | 9 | 28 | 357 | $47,165.55 |
| New Mexico | 46 | 34 | 733 | $20,482.26 |
| New Jersey | 6 | 49 | 1,145 | $62,275.46 |
| Iowa | 9 | 31 | 1,171 | $27,291.37 |
| Rhode Island | 3 | 42 | 197 | $87,691.37 |
| Hawaii | 5 | 46 | 178 | $33,517.42 |
| Delaware | 5 | 40 | 163 | $24,142.94 |
Now Try Zippia’s Job Search
Author
Kathy is the head of content at Zippia with a knack for engaging audiences. Prior to joining Zippia, Kathy worked at Gateway Blend growing audiences across diverse brands. She graduated from Troy University with a degree in Social Science Education.